
Trame: Visual Analytics Everywhere
Some of the most powerful computing tools are based on the concept of visual analytics “the science of analytical reasoning facilitated by interactive visual interfaces”.[1] Typically such software tools combine advanced visualization, charting, and interactive interfaces to provide an environment that facilitates exploration, analysis, and understanding of complex data and systems. However, creating effective visual analytics tools is difficult, especially if the software is meant to be used across multiple computing environments. Some of these challenges include supporting:
- a wide variety of computing platforms (mobile, desktop, cloud, HPC);
- associated operating systems including Linux, Mac/iOS, and Windows;
- programming languages (Python, JavaScript, C++, and so on);
- graphics libraries such as OpenGL, Vulkan, Metal, and WebGPU;
- client-server applications to support large data processing and/or computational loads, or to enable client-side rendering or server-side rendering;
- integration with other tools such as JupyterLab; and
- easy to create graphical user interfaces (GUIs), portable across computing platforms.
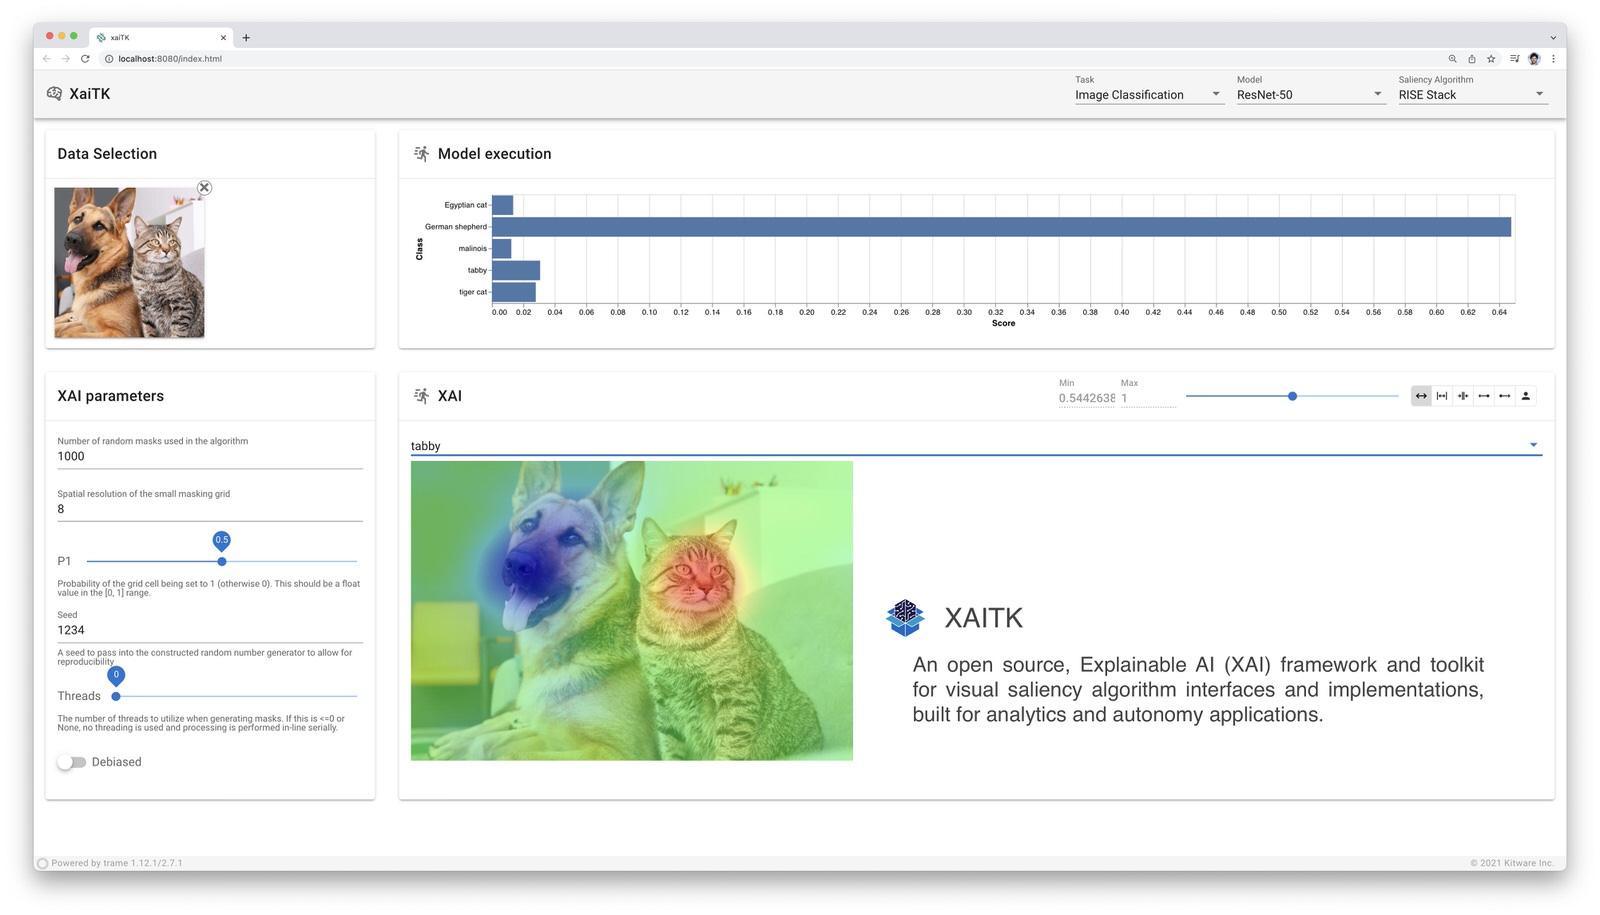
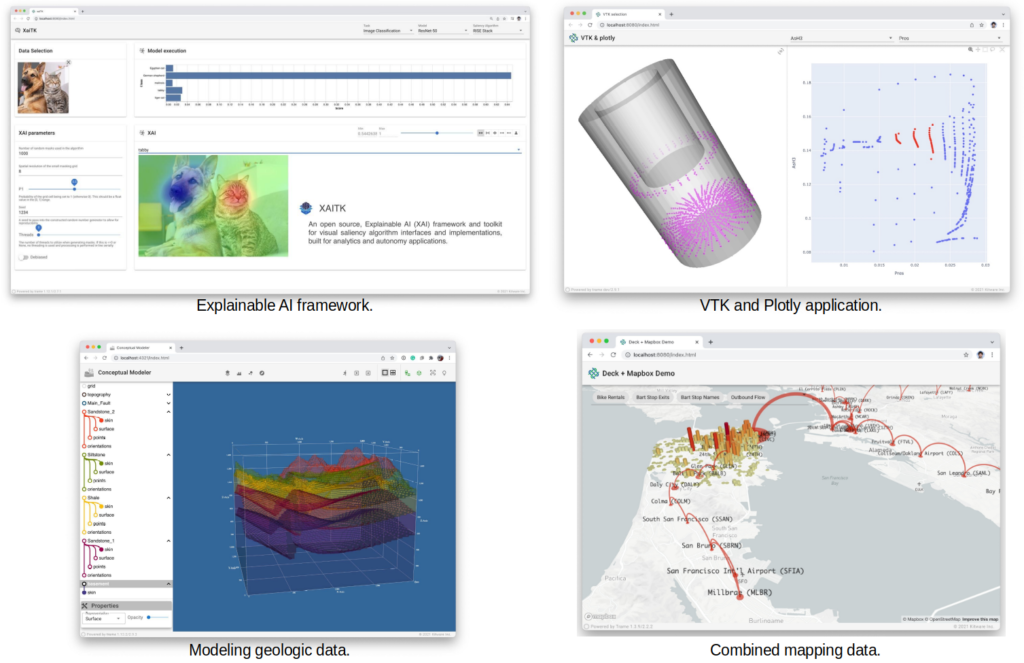
In what we consider to be a breakthrough technology development, Kitware has created trame, a simple, easy-to-use, Python- and web-based framework for visual analytics that weaves together powerful open source components and systems. Based on the culmination of decades of work with the visualization systems VTK, VTK.js, and ParaView, trame enables the creation of applications meeting the requirements above with simple Python scripts; and leverages Python’s powerful integration capabilities to leverage open platforms such as Vuetify (for powerful GUIs), Plotly, and Matplotlib; or even used within popular scientific workflow systems like JupyterLab. With trame it is possible to build visual analytics applications that run across all common computing platforms, support the demands of large-scale computing, and can be easily deployed through the web browser. The figures below shows typical examples of trame applications.
Sneak Peek
These are clearly tall claims so a simple example is in order to demonstrate a few of trame’s capabilities. Before beginning here are a few notes:
- Python is used to build trame applications. Under the hood however other programming languages such as JavaScript and C++ may be used. For example, trame leverages the JavaScript VTK.js library, and the VTK C++ toolkit. However, these languages are generally not directly used in an application, trame takes care of the necessary integration. So as long as Python integration/interface is available, trame can incorporate it into an application.
- Trame is inherently a web application running in a web browser. However, depending on the platform and the manner the application is invoked, a trame application appears as a desktop, local web client, or even client-server application. No code changes are necessary across these application types.
- Client-server coordination and transfer of state and data is handled completely transparently by trame. As a result, it’s possible to transparently use and switch between client-side rendering in which the local computer (and its graphics hardware) performs rendering using geometry and data transferred from a server, or server-side rendering in which a remote server machine renders geometry and data and sends the trame client the final image.
- Trame leverages Vuetify to create powerful GUIs. While Vuetify is a JavaScript web framework, trame provides a simple Python integration layer so that Vuetify’s many dozens of components can be employed in trame applications.
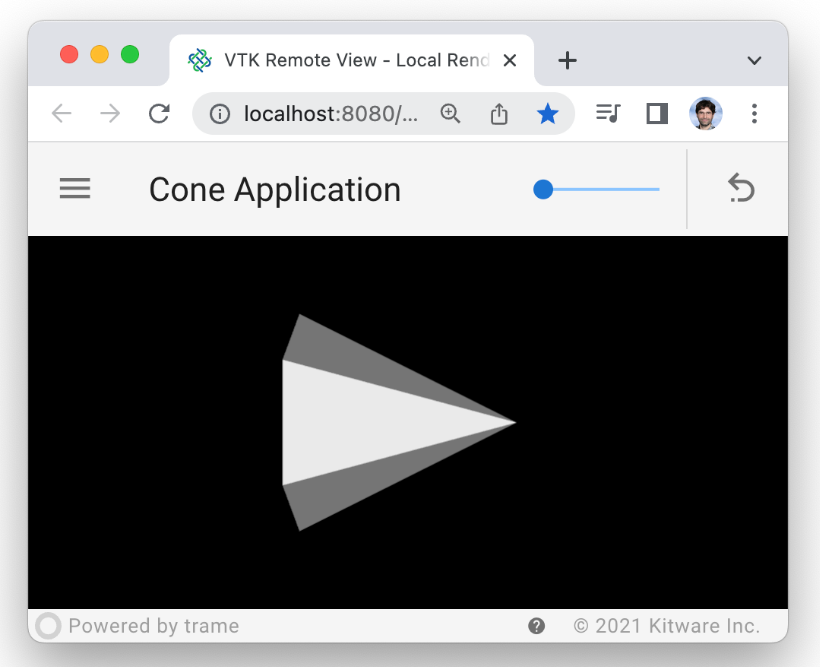
With these notes behind us, here is the trame code to display a polygonal representation of a cone (see the figure above). Notice how (if you are a VTK user) the code looks very familiar using the standard VTK rendering objects and pipeline. What’s different here is the early import of modules, and the definition of a SinglePageLayout and associated GUI elements (such as a slider to set the cone resolution, and a button to reset the cone resolution).
from vtk import *
from trame.app import get_server
from trame.widgets import vuetify, vtk
from trame.ui.vuetify import SinglePageLayout

DEFAULT_RESOLUTION = 6

server = get_server()
state, ctrl = server.state, server.controller

renderer = vtkRenderer()
render_window = vtkRenderWindow()
render_window.AddRenderer(renderer)

render_window_interactor = vtkRenderWindowInteractor()
render_window_interactor.SetRenderWindow(render_window)
render_window_interactor.GetInteractorStyle().SetCurrentStyleToTrackballCamera()

cone_source = vtkConeSource()
mapper = vtkPolyDataMapper()
actor = vtkActor()
mapper.SetInputConnection(cone_source.GetOutputPort())
actor.SetMapper(mapper)
renderer.AddActor(actor)
renderer.ResetCamera()

@state.change("resolution")
def update_cone(resolution, **kwargs):
    cone_source.SetResolution(resolution)
    ctrl.view_update()

def update_reset_resolution():
    state.resolution = DEFAULT_RESOLUTION

with SinglePageLayout(server) as layout:
    layout.icon.click = ctrl.view_reset_camera

    with layout.toolbar:
        vuetify.VSpacer()
        vuetify.VSlider(
            v_model=("resolution", DEFAULT_RESOLUTION),
            min=3, max=60, step=1,
            hide_details=True, dense=True, style="max-width: 300px",
        )
        vuetify.VDivider(vertical=True, classes="mx-2")
        with vuetify.VBtn(icon=True, click=update_reset_resolution):
            vuetify.VIcon("mdi-undo-variant")

    with layout.content:
        with vuetify.VContainer(fluid=True, classes="pa-0 fill-height"):
            view = vtk.VtkLocalView(render_window)
            ctrl.view_update = view.update
            ctrl.view_reset_camera = view.reset_camera


if __name__ == "__main__":
    server.start()
In this example, the vtk.vtkLocalView() defines indicates that rendering is to be performed on the client side. However, the pipeline consisting here of a vtkConeSource and vtkPolyDataMapper (any VTK pipeline is supported), which executes on the server side, with the resulting graphics primitives sent to the client. The resulting image is displayed in a standard web browser as shown. However, if the vtkLocalView() is changed to a vtkRemoteView(), then the rendering also occurs on the server side, and the resulting image is sent to the client for display.
Obviously there is a lot of magic going on behind the scenes, and details need to be expanded upon. But for very little code, a web-based, visual analytics application has been created that supports client-server processing, is portable across multiple computing platforms, and provides a nice looking GUI.
Coming Soon
This is the first post in a blog series that will walk through trame and some of its many features. We will take a look under the hood and describe how trame orchestrates its many software components. We will also show how Vuetify can be used to create compelling GUIs, and how trame integrates with many powerful systems such as VTK/ParaView, JupyterLab, PyVista, Vega, Plotly and more.
Although trame is under active development, it has matured to the point where it is routinely used at Kitware to build commercial and research applications for our customers. There are many resources available to learn more. The trame web site is a great starting point, especially the tutorial. Also check out the Examples Gallery and Applications which include source code and other assets needed to run the code. If you prefer video, here’s a tutorial presentation from the Supercomputing 2021 conference. For the more ambitious, the Python VTK Examples can readily be converted into trame applications by modifying just a few lines of code (we will cover this in an upcoming blog post – hint use the VtkLocalView or VtkRenderView as appropriate). Finally, if you want to accelerate the learning process, or use trame for your own work, contact Kitware for training, support, and/or application development services.
[1] Cook, Kristin A, and Thomas, James J. Illuminating the Path: The Research and Development Agenda for Visual Analytics.2005. Web.
The example can be ran within a virtual environment like so
python3.9 -m venv py-env

source ./py-env/bin/activate

pip install trame vtk

python ./example.py