Developing Open-source Geospatial Analytics Capabilities
The variety of data in the geosciences domain has led to the creation of tools with different application programming interfaces (APIs) and data structures. Such fragmentation leads to difficulties and inefficiencies in performing new comprehensive studies. This blog provides a preview of what is possible using Gaia, an open-source geospatial analytics toolkit that we are developing with Booz Allen Hamilton (BAH).
Gaia offers analytics capabilities that include geospatial visualization, spatial and remote-sensing analysis and web-enabled applications. The toolkit wraps the most commonly used and advanced spatial algorithms under a unified API. Accordingly, it can work with vector data (e.g., GeoJSON, shapefiles and PostGIS databases) and raster data (e.g., GeoTiff images).
Some of the analytics capabilities that Gaia has include buffer generation, area calculations, geometric intersections and unions, raster algebra and zonal statistics. Minerva enables access to these capabilities in Gaia. Minerva is a Girder plug-in that performs visual geospatial analytics for exploratory data analysis and visualization. While the plug-in currently supports the vector data format GeoJSON, we plan to expand support to include raster imagery.
Below, we explore a use case of vector data of Massachusetts. This use case applies to a scenario in which an analyst has reports of a natural catastrophe (e.g., flooding or a disease outbreak) along a major highway. In such a scenario, the analyst may want to find out what towns are potentially affected by the catastrophe so that a warning or an advisory can be sent to them. Here is how the analyst can obtain this information.
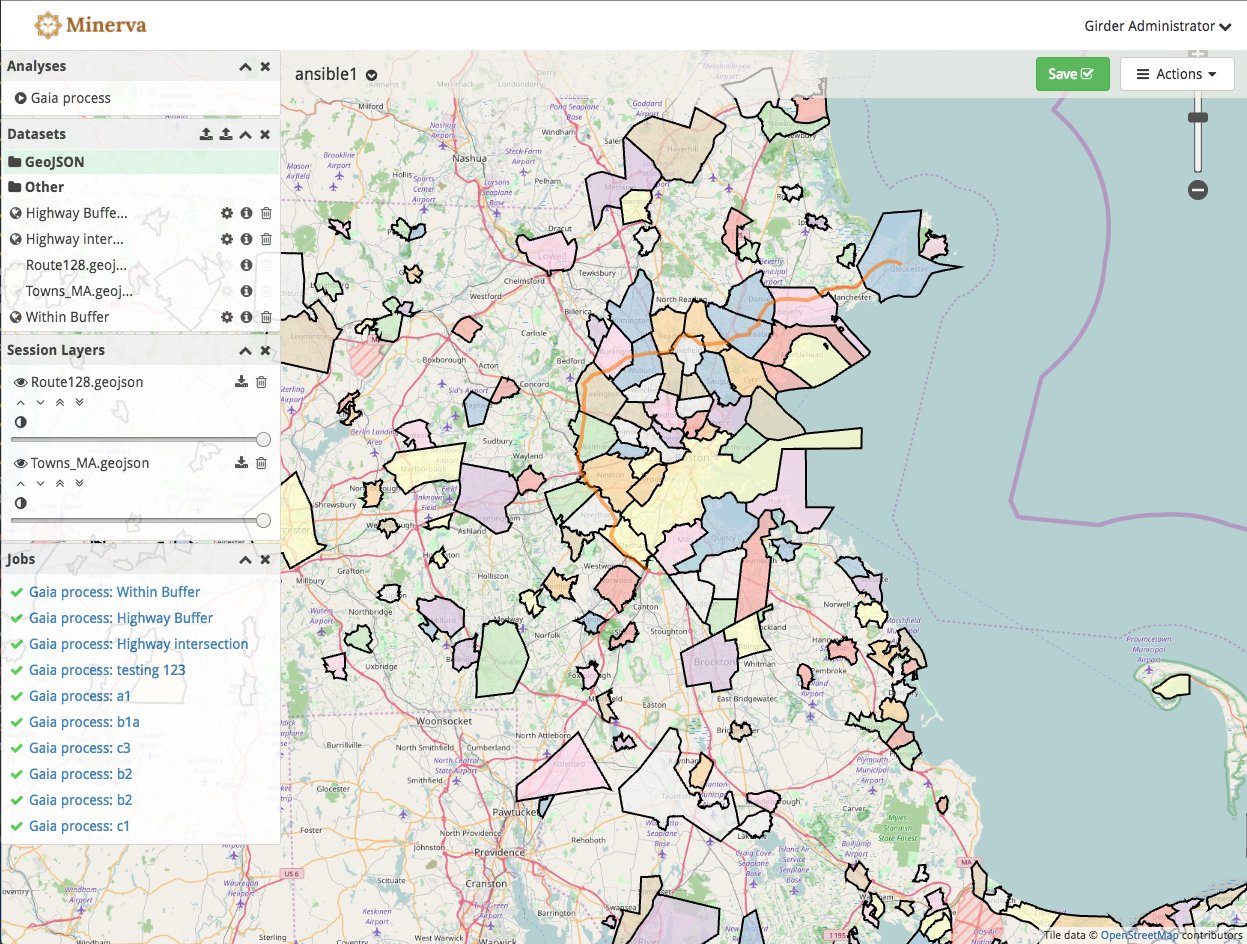
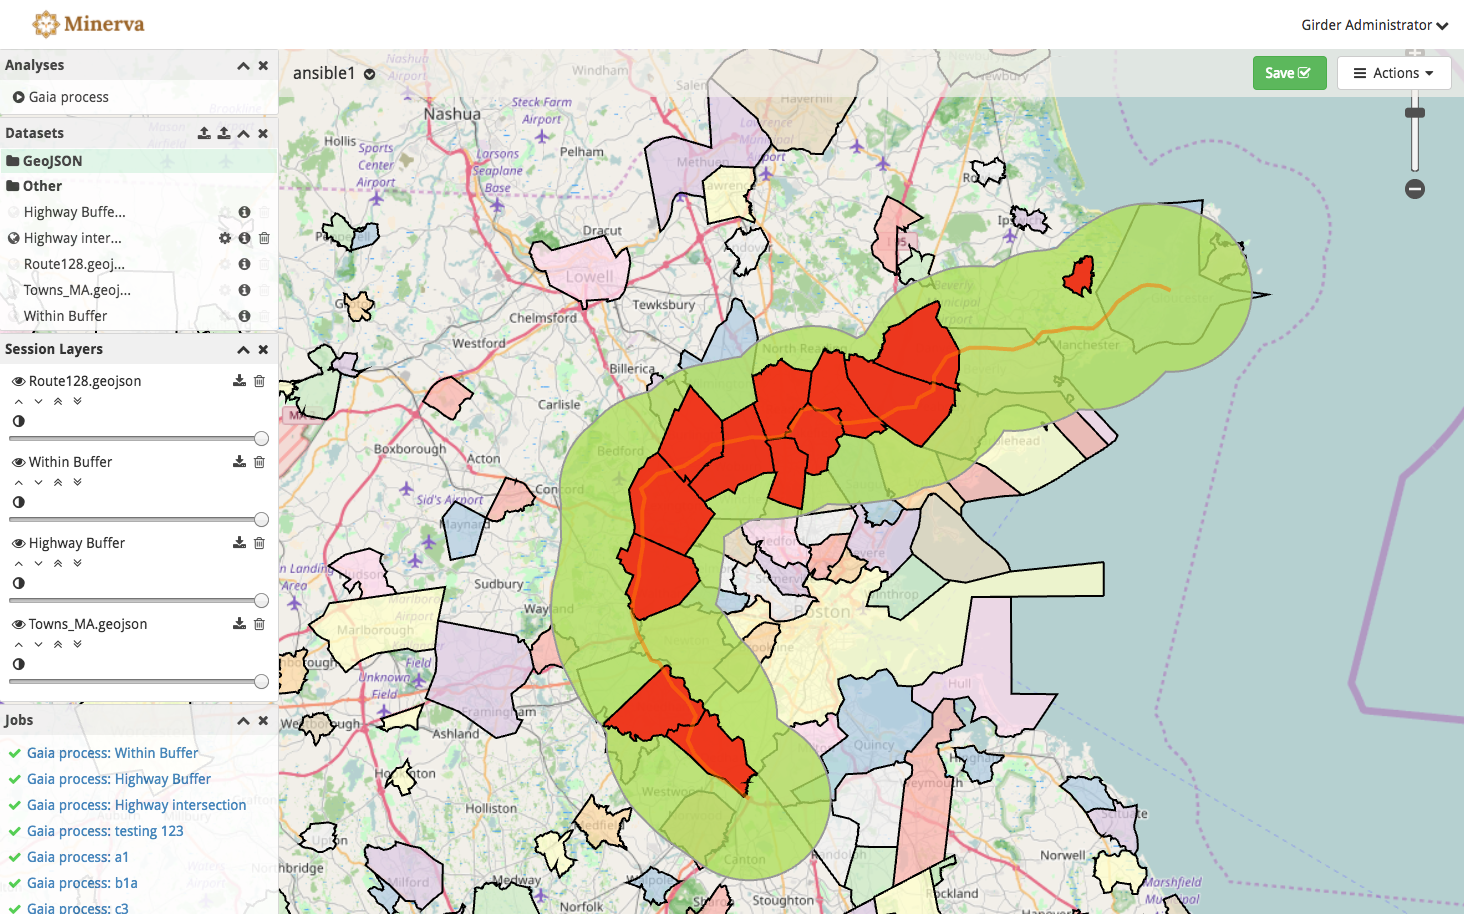
Step 1: Upload the vector data in Minerva.
In this case, the data contains towns and a highway, Route 128.
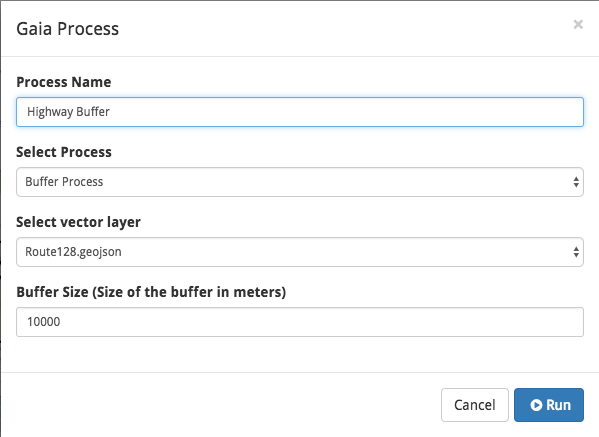
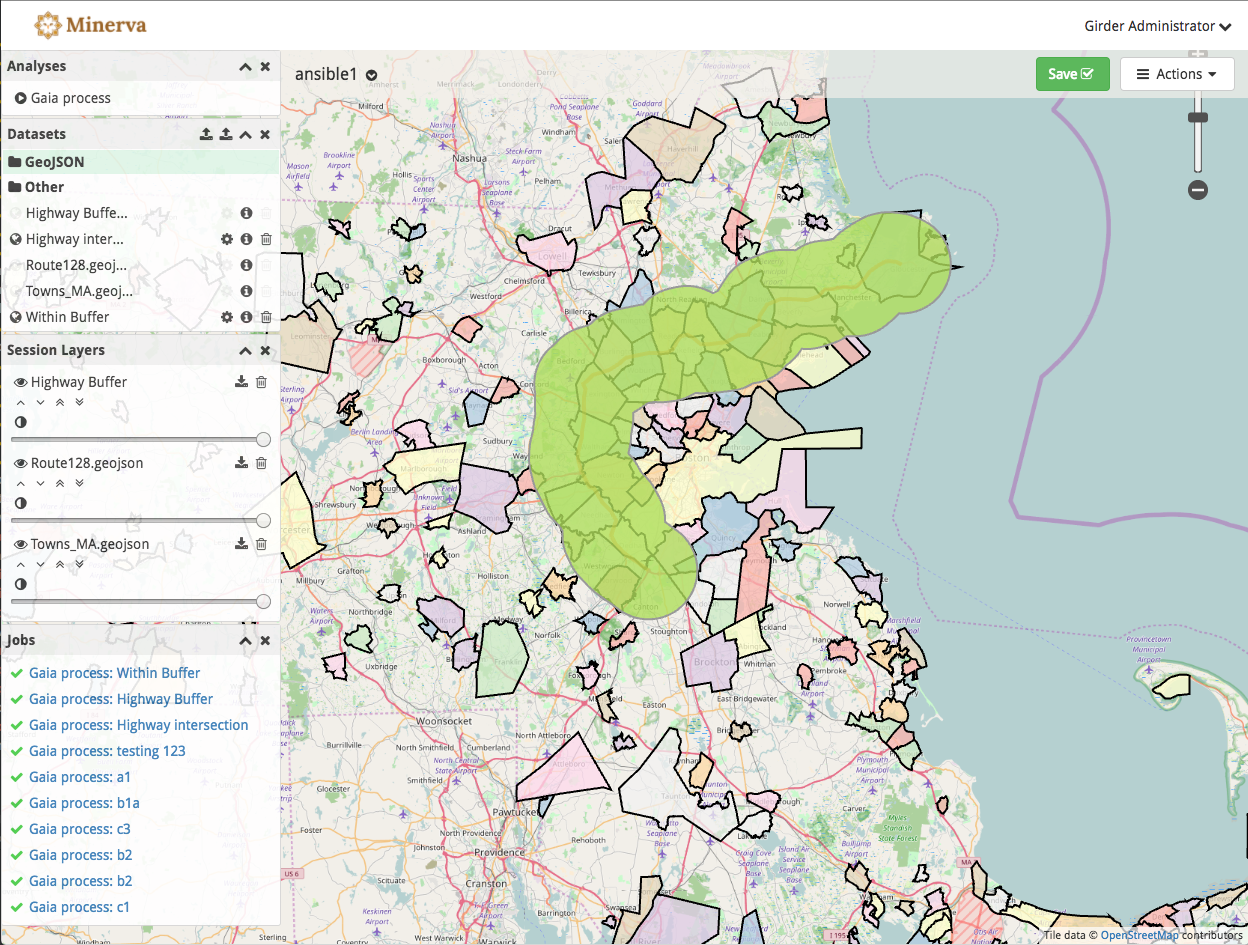
Step 2: Generate a buffer around the highway.
The buffer appears in green.
Step 3: Select the town boundaries that fall completely within the buffer.
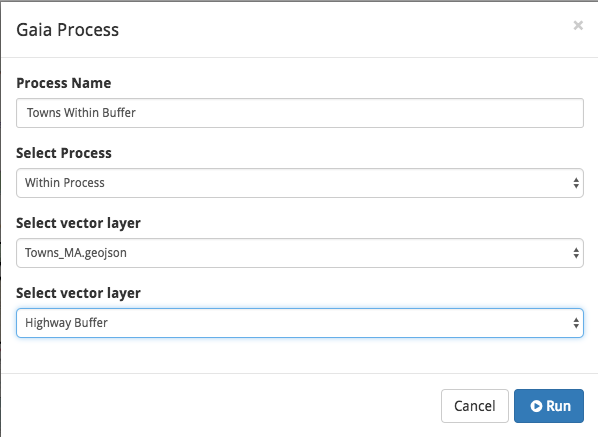
In the final result, the towns appear in orange.
For more exciting live examples, please visit the documentation for Gaia. The documentation uses Jupyter to demonstrate various features that Gaia currently supports.
Please contact kitware@kitware.com if you have any questions or if you have would like more details on the open-source geospatial capabilities we provide.