Analyzing Ensembles of Curves with ParaView using the Functional Box Plots and Bag Plots
In recent years ParaView has been enriched with several views for the analysis of ensembles of curves. In this post we overview the use of these views, in particular the Functional Boxplot View and the Bag Plot View.
Visualizing and understanding ensembles of curves
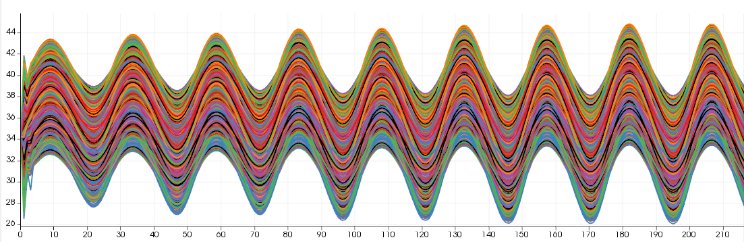
An ensemble of curves presents a first problem of visual clutter, which is well known in the visualization community. When a large number of curves are superposed to one another, the overall perception of the graphs is lost, and the user cannot analyze the ensemble. As an example, Fig. 1 depicts 1500 curves coming from different runs of the same numerical simulation (from a hydraulic application). When looking at the overall behavior of an ensemble of curves, such as Fig. 1, the first set of basic questions that arise is the following:
- What is the median curve?
- Can we define some confidence interval curves containing most of the curves – as done usually for scalar random variables with the boxplot tool?
- Can we detect some abnormal curves, in the sense of a strong difference from the majority of the curves (as outliers for scalar variables)?
- Are there some clusters, which correspond to different behaviors of the physical model that generated these outputs?
The FunctionalBoxplotView, in combination with the BagPlotView, is designed to answer the above questions:
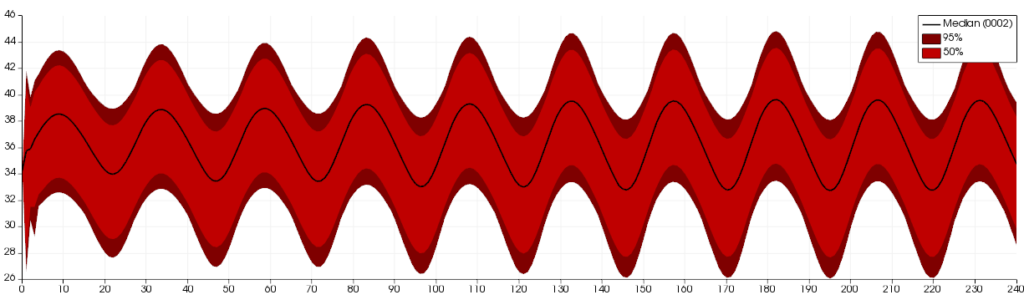
- The FunctionalBoxplotView is the extension of the classical boxplot to functions. A boxplot for scalar variables allows summarizing the main information of a data sample: median, first and third quartiles, and an interquantile-based interval which define the limit of non-outliers data. Fig. 2 shows the analysis of the dataset shown in Fig. 1: the 50% interquantile area is represented in light color and dark is used for the 95% interquantile zone. The median curve is represented in black.
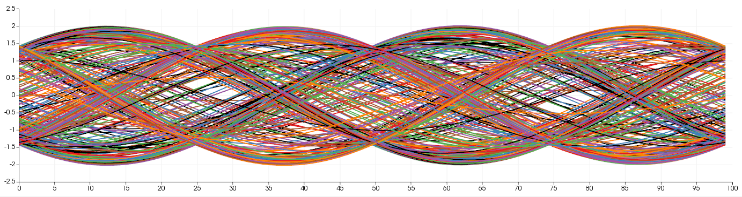
- The BagBoxplotView is a 2D view that shows the density distribution of the curves in a plane and is used for interactive visual clustering. In Fig. 3, we show some results concerning an ensemble of temporal oscillating functions. On the top panel (a), 400 curves are shown. Figure 3(b) shows the result of a user interaction with the BagBoxplotView of the 400 curves, where a blue to red color-map is applied. We can see that four clusters appear, indicating a multi-modal structure of the oscillating curves. The analyst has selected one of these clusters, then the propagated selection on the curves is highlighted on the linked FunctionalBoxplotView, this selection corresponds to variations of the same oscillating mode. This example demonstrates the interest of visualizing and interacting with the BagBoxplotView in the context of a partitioning task. Understanding a multi-modal ensemble of curves is indeed a complex analysis task, which is facilitated by this view.
We remark that the user explores the ensemble of the curves by the joint visualization of these two views, which are by default linked and interactive.
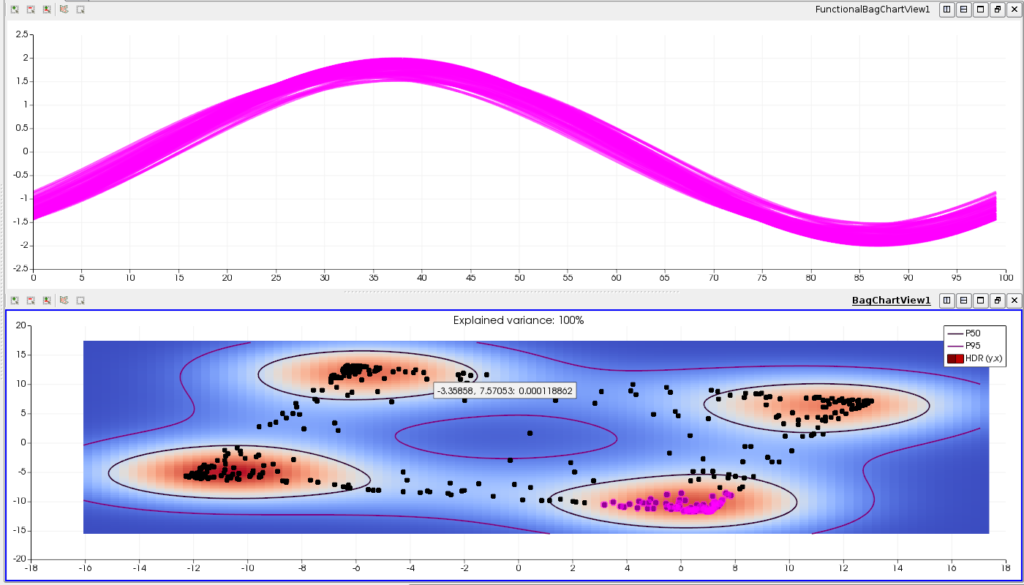
The bottom panel (b) shows the results of a user interaction where the analyst has selected (pink points) one of the clusters of the BagBoxplotView.
A visual sensitivity study
A probabilistic uncertainty study consists of evaluating the computer model on a large size statistical sample of model inputs (which follow a joint probability distribution), then analyzing all the results (the model outputs) with specific statistical tools. The result of such a family of runs is called an ensemble, and each individual run is called a member. Ensembles are multivariate, which means that a simulation is run several times with varying parameters. Their members are multidimensional (both in space and time) and multivalued (several quantities such as temperature, pressure, or velocity are considered). One popular way to deal with these kinds of complex outputs is to limit the analysis to several probes in the temporal/spatial domain. This leads to an ensemble of curves, which can be analyzed in ParaView by use of the Functional Boxplot View and the Bag Plot View.
An example of such a strategy can be a hydraulics engineer studying results generated by a multi-run finite element simulation. In this case, the ensemble could be a fixed three-dimensional mesh for all members and a varying field (temperature, water height, pressure, etc.) that depends on the experimental design used to sample the parameters controlling the simulations. Thus, when the engineer applies a probe on a node of the mesh, she/he obtains not the evolution of a quantity (temperature, water height, pressure, etc.) over time but another smaller ensemble of functional outputs or curves. We should then not only deal with an ensemble of functional outputs but also with their associated simulation parameters. We call this kind of data an augmented ensemble of curves. [Ribés et al, 2019] describes in detail how ParaView can be used to analyze this kind of data.
Give it a try with our open-data
Three open-data use cases to test the FunctionalBoxplotView and the BagBoxplotView are publicly available at:
https://gitlab.kitware.com/edf/visual-sensitivity-analysis-of-curves
They are accompanied by ParaView Python scripts and some guidelines to be easily reproduced. Furthermore, the article [Ribés et al, 2019] describes in detail, using this data, how to use ParaView for the analysis of ensembles of curves in the context of uncertainty quantification studies.
Acknowledgments
This work was supported by EDF (Electricité de France)

References
[Ribés et al, 2019] A. Ribes, J. Pouderoux, B. Iooss. “A Visual Sensitivity Analysis for Parameter-Augmented Ensembles of Curves.” ASME. J. Verif. Valid. Uncert. December 2019; 4(4): 041007. https://doi.org/10.1115/1.4046020