Cyclone Chapala Simulation with ParaView Catalyst through KAUST Imshimtu Library
This is a guest blog from James Kress & Thomas Theussl, visualization scientists at King Abdullah University of Science and technology (KAUST), Saudi Arabia.
Context
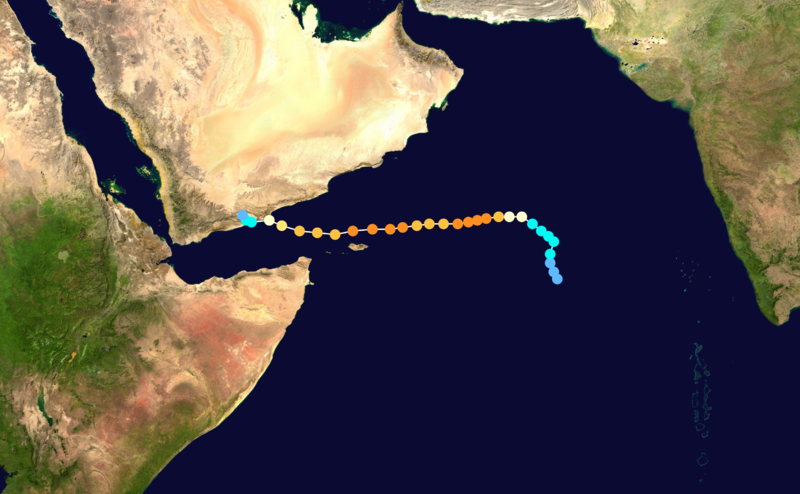
Cyclone Chapala formed over the Arabian Sea in 2015 and it was one of the strongest tropical cyclones on record in the Arabian Sea, with sustained wind speed estimated to be of 240 km/h (150 mph). Through Yemen, Oman and Somalia, the known damages are more than $100 millions and about 8 people died.
Scientists at King Abdullah University of Science and technology (KAUST), Saudi Arabia, have built a Weather Research and Forecasting (WRF) model to analyze the phenomenon and understand its impact by visualizing the cyclone. The goal was to study the cyclone behavior and to provide better data to help circumvent similar natural disasters in the future.
The WRF model has been described at https://ieeexplore.ieee.org/document/7756074. This is a limited area, non-hydrostatic primitive equation model including multiple options for various physical parameterization schemes. The implemented configuration is composed of two, two-way interactive nested domains with horizontal resolutions of 9 km and 3 km respectively. The vertical column is discretized into 34 vertical levels, 15 of which are in the lower troposphere to accurately represent the boundary layer characteristics. The model physics include the Mellor Yamada Janjic turbulent kinetic energy for boundary layer processes, the Milbrandt-Yau 2-moment scheme, for microphysical processes, the Noah land surface scheme for surface processes, the Rapid Radiation Transfer Model (RRTM) for long-wave radiation, and the Dudhia scheme for short-wave radiation. Only the 3 km resolution model outputs are considered for this analysis. The model is integrated for six days starting from the depression stage of the storm. The simulation was performed in 3 hours using 640 cores on the High Performance Computational Facility Shaheen II (https://www.hpc.kaust.edu.sa/content/shaheen-ii) at King Abdullah University of Science and Technology (KAUST, Saudi Arabia).
One of the challenges of the study was to handle the size of the model. This is a 1100x1000x34 regular grid with 138 time steps and it focuses on velocity field and scalar fields for cloud, graupel, ice, rain, snow, and vapor. The total size is about 300 GB. At this scale, the input/output (I/O) operation during numerical simulation becomes the performance bottleneck and the state-of-the-art solution is to use in situ analysis and visualization.
In Situ Visualization and Analysis
In situ visualization and analysis is a technique to couple the visualization processing with simulation and occurs whilst the simulation is running. By coupling these together we can utilize the high performance computing for post processing, and we can circumvent the bottlenecks associated with storing and retrieving data in disk storage. In situ visualization is a valuable yet underutilized commodity for the simulation community. There is hesitance or even resistance to adopting new methodologies due to the uncertainties that in situ holds for new users. There is a perceived implementation cost, maintenance cost, risk to simulation fault tolerance, potential lack of scalability, a new resource cost for running in situ processes, and more. The list of reasons why in situ is overlooked is long. We are attempting to break down this barrier by introducing Inshimtu. Inshimtu is an in situ “shim” library that enables users to try in situ before they buy into a full implementation. It does this by working with existing simulation output files, requiring no changes to simulation code. The core visualization component of Inshimtu is ParaView Catalyst, allowing it to take advantage of both interactive and non-interactive visualization pipelines that scale. We envision Inshimtu as a stepping stone to show users the value of in situ and motivate them to move to one of the many existing fully-featured in situ libraries available in the community. Inshimtu is GPL Licensed and available for download at: https://github.com/kaust-vislab/Inshimtu-basic.
Design of Inshimtu
Inshimtu is so named because it is our vision that this code is an in situ shim that can be used to augment existing simulations with in situ capabilities. The goal of Inshimtu is to provide a stepping stone for users coming from a post hoc processing world to try in situ with no development required. Simulations write their output to temporary files where Inshimtu reads, processes, visualizes, or creates subsets, and can even delete the original output files, saving only what is interesting or useful. The heavy lifting in Inshimtu is accomplished with VTK and Catalyst. Inshimtu creates VTK data sets from the simulation output and processes them with Catalyst. This process is illustrated in Figure 2. Of course, the use of Inshimtu comes with a cost. Inshimtu is not real in situ, the traditional advantages of in-situ, like speeding up simulation execution time by avoiding costly I/O, can obviously not be exploited.
Using Inshimtu
Enabling Inshimtu amounts to adding a line to the Slurm batch file before running a simulation code. No changes to the simulation code are required. The simulation code is not aware of Inshimtu, and no coupling or synchronization exists between the simulation and Inshimtu. Once the simulation is actively running and saving its outputs to disk, Inshimtu takes those outputs from disk, processes them with a Catalyst script (users can even connect live with ParaView if desired), saves the outputs (images, extracts, summary statistics, etc.), and then watches and waits for new outputs to appear. Once the simulation terminates, the batch script updates a “*.done” file which Inshimtu watches in order to know when all processing is complete. For a series of examples on how to launch Inshimtu, along with associated Catalyst scripts, see our examples on GitHub: https://github.com/kaust-vislab/Inshimtu-basic#running
Chapala WRF Simulation
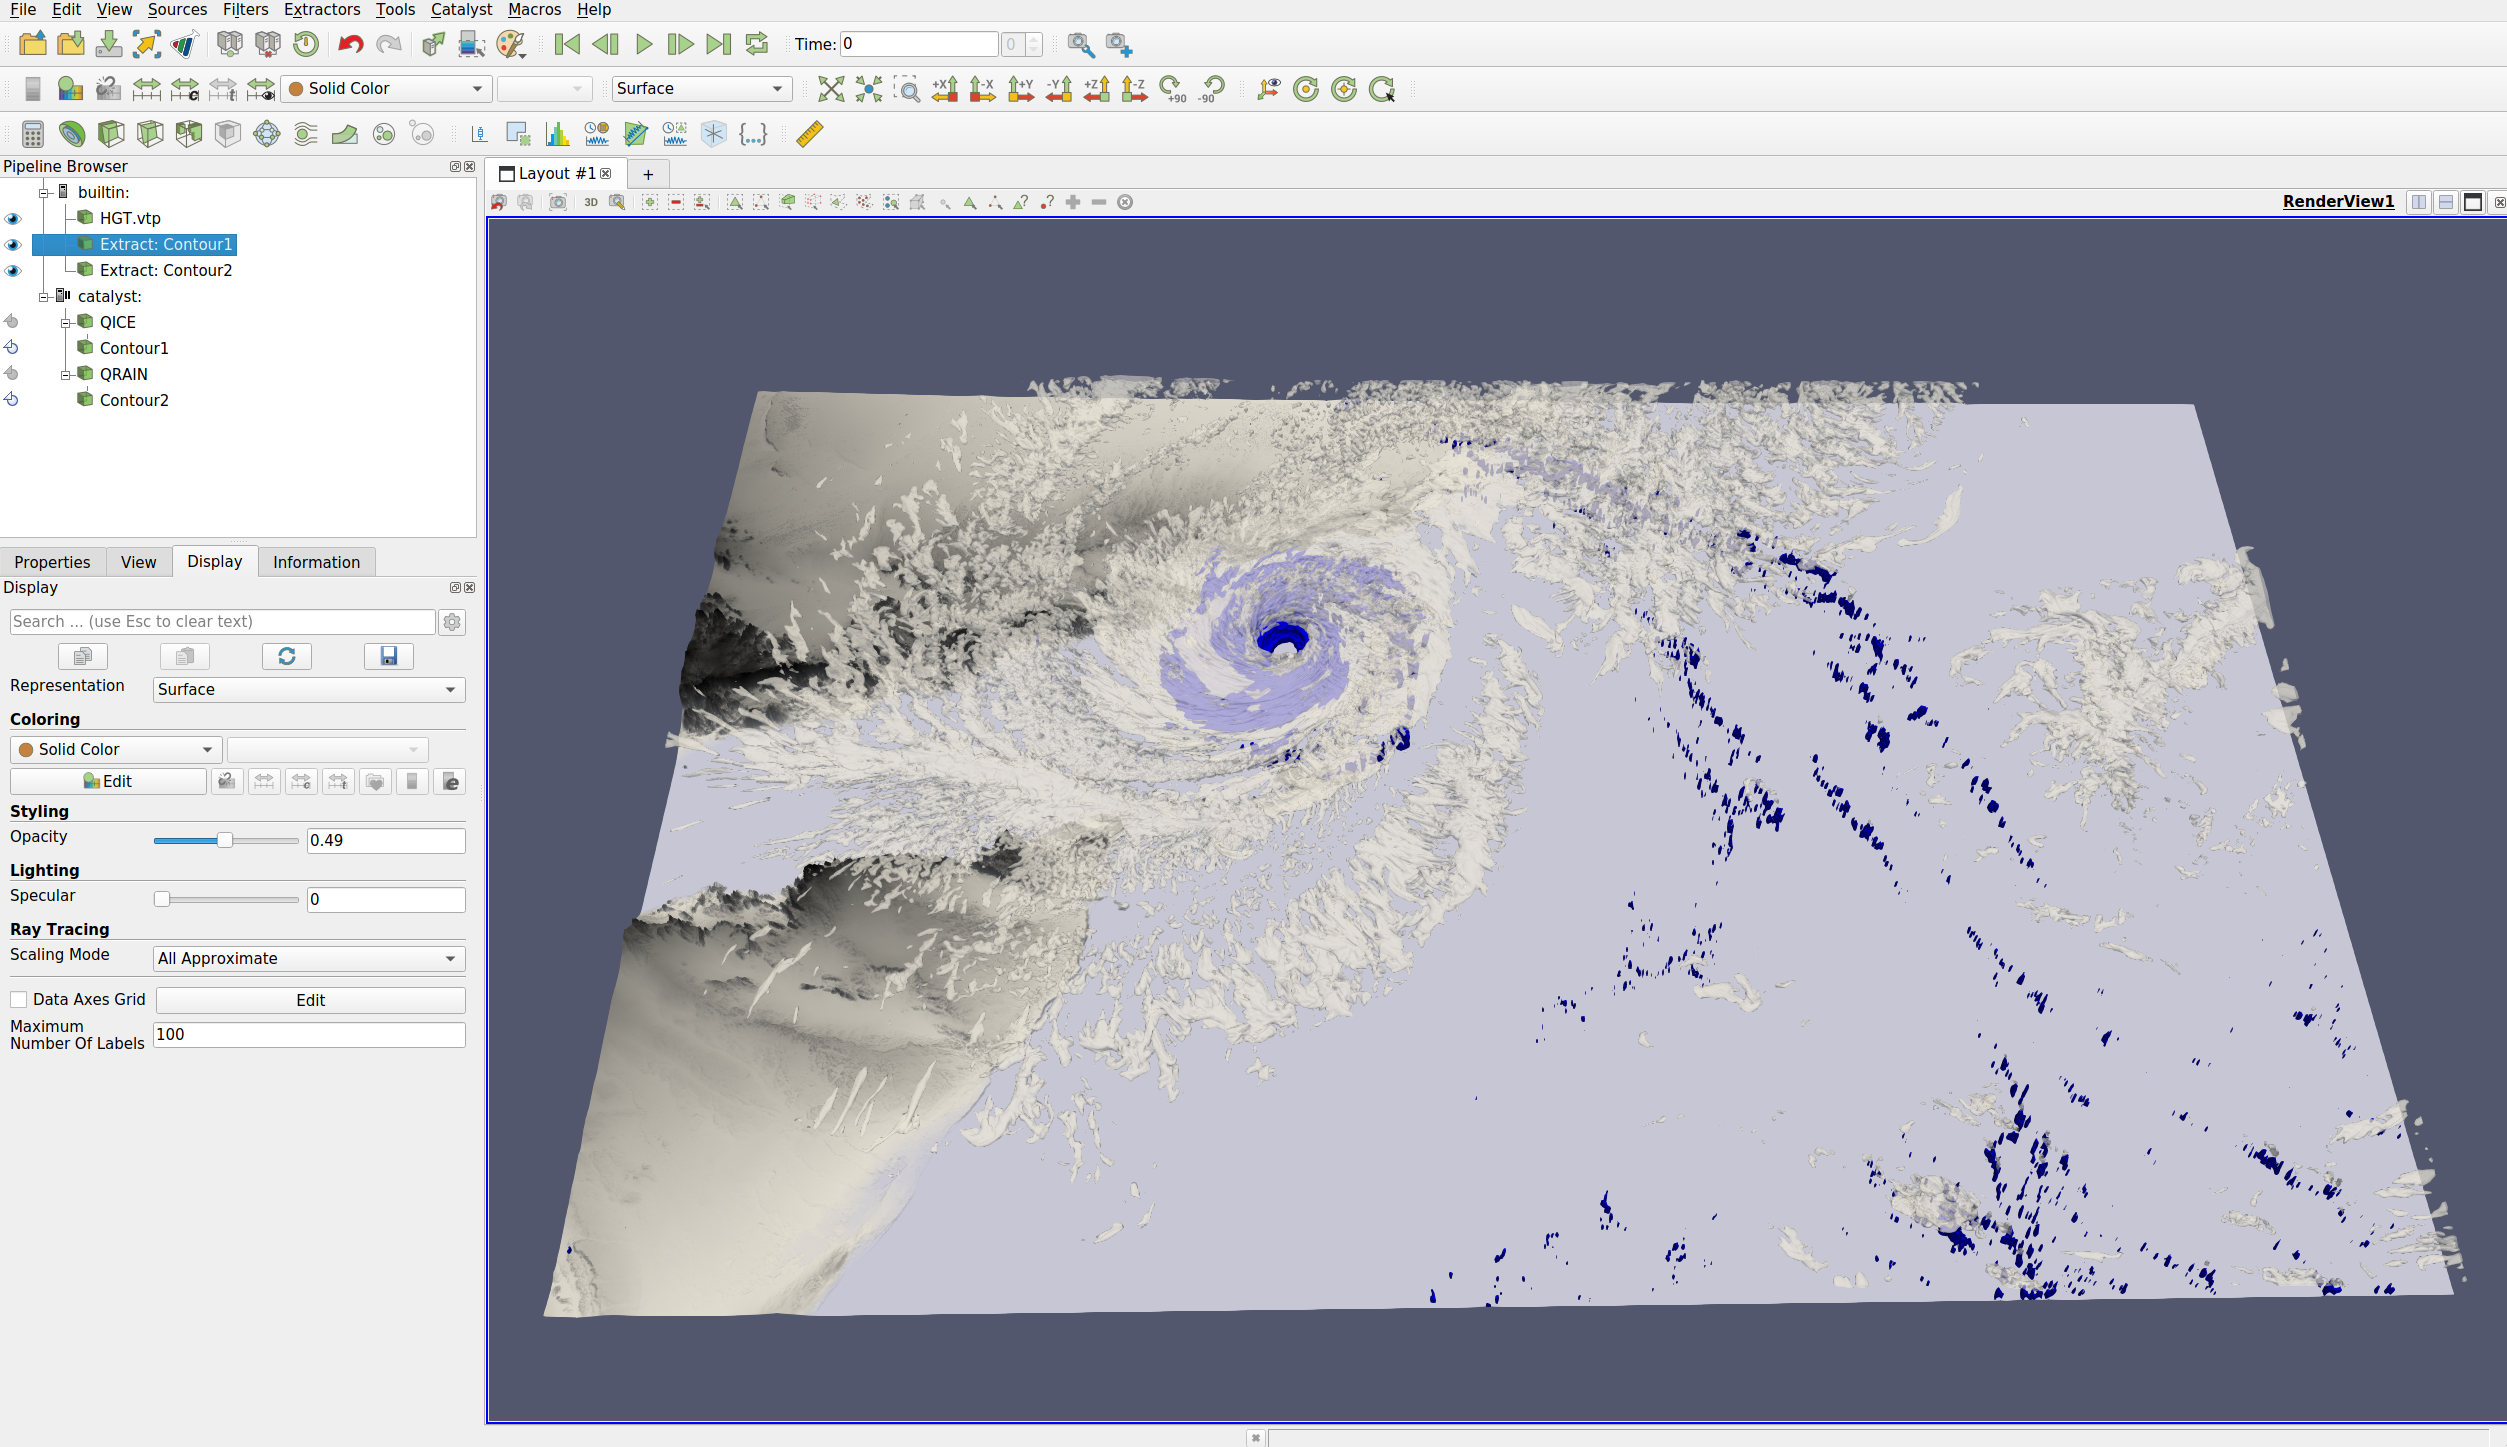
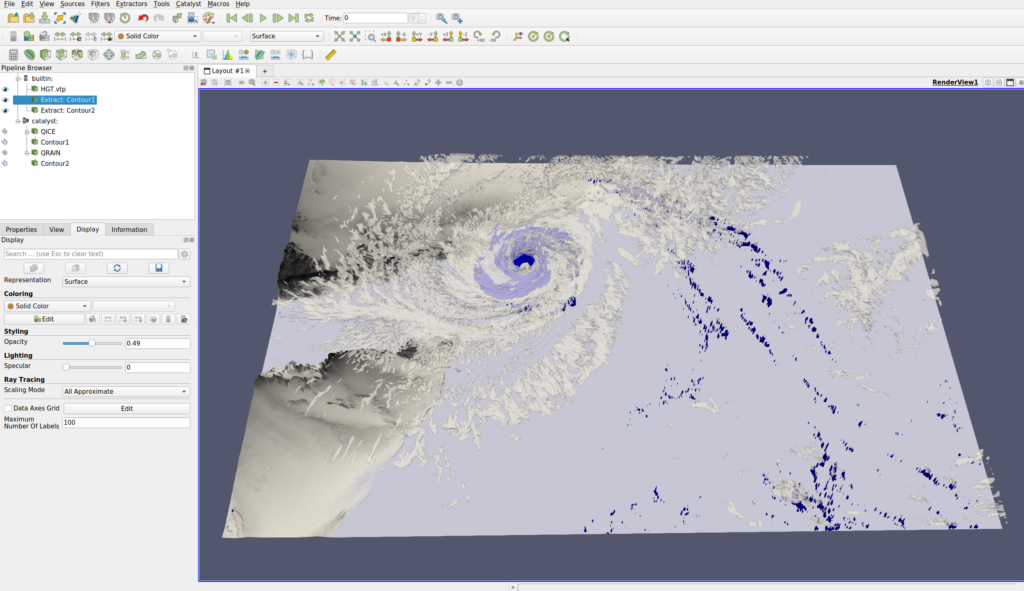
To demonstrate the capabilities of Inshimtu and ParaView Catalyst, we used the WRF simulation code run on Shaheen II at KAUST. WRF was chosen as an example code as there is a large user community at KAUST and it can produce vast quantities of data when looking at fine temporal resolutions. We ran WRF configured to simulate the Cyclone Chapala from 2015. The premise behind this visualization is that the scientists were interested in creating a video of the cyclone track, which comprises only a small portion of the simulation domain. With Inshimtu we were able to save only a region of interest around the cyclone center at each step, vastly reducing disk usage. A video of the extracted region of interest (ROI) is shown in Figure 4. A rendering of the variable “QRAIN” in that ROI is shown in Figure 5.
Conclusion
The Chapala simulation itself was an important step for researchers at KAUST because it allowed them to fine tune their WRF model and the projected track of the cyclone. By understanding why models at the time were giving widely varying predictions, they will enable more accurate future predictions of cyclone tracks in the Arabian Sea. This is an ongoing collaboration between KAUST and the Saudi Arabian government on climate modeling and prediction, with the goal of creating more accurate weather predictions day-to-day in order to help safeguard lives and property.
The integration with Inshimtu was beneficial to this simulation, as it simplified the integration of in situ into the scientists existing WRF pipeline. Due to the resolution of the grid and the number of simulation steps necessary to evolve the simulation, in situ was critical as it allowed the simulation files to be processed and deleted as they were being produced, keeping only the most necessary data on the limited disk space. In addition, the images of the cyclone track that were being produced each step enabled the scientists to tune their simulation parameters more quickly, as simulations with errant tracks could be stopped early, saving compute resources, something that would have been more time consuming without automatic visualization at each step.
The visualization community is investing heavily into creating and expanding various in situ visualization libraries and frameworks. These efforts are becoming well established and are ready for integration into simulation codes. However, community adoption of in situ is low, and it is difficult to quickly demonstrate the benefits of in situ for each and every simulation code. Therefore, we presented Inshimtu as a stepping stone towards full in situ visualization workflows.
This work has led to a short paper presented by KAUST at the WOIV’23: 7th International Workshop on In Situ Visualization held in conjunction with ISC 2023. The paper is available for download now:
Kress, J., Holst, G., Dasari, H.P., Afzal, S., Hoteit, I., Theußl, T. (2023). Inshimtu – A Lightweight In Situ Visualization “Shim”. In: Bienz, A., Weiland, M., Baboulin, M., Kruse, C. (eds) High Performance Computing. ISC High Performance 2023. Lecture Notes in Computer Science, vol 13999. Springer, Cham. https://doi.org/10.1007/978-3-031-40843-4_19