Drawing Lines in GeoJS
Authors: David Manthey, Aashish Chaudhary
Short Summary
We refactored WebGL line drawing in GeoJS. We now have less bugs and lots of features, including some options our competitors don’t have. We can render millions of line segments very quickly. There are more features would could add in the future.
Introduction
For the NASA-NEX (https://nex.nasa.gov/nex) AIST grant, Kitware and NASA are developing interactive analytics solutions that will provide an interactive notebook to remote computing systems that processes and visualizes petabyte scale Earth-science data. As part of this effort, geospatial and climate data is visualized using geospatial maps using Kitware’s open-source GeoJS (github.com/OpenGeoscience/geojs) and KTile (https://github.com/OpenGeoscience/ktile) libraries. The goal is to enable users to select areas of interest to indicate where further processing is required and to tag notable features. Regions of the data are shown using GeoJS’s annotation features.
A few line-drawing bugs surfaced while working on displaying annotations because some edge-cases were not handled correctly in GeoJS. For example, when drawing a polygon around a geographic region, sharp corners sometimes looked subtly wrong. These flaws were much more apparent with wider lines. Also desired were improvements to the overall quality of line rendering and better visuals for line data properties. Any improvements made needed to preserve the performance (frames per second) of our existing fast implementation which could render a large number of lines very quickly.
On Drawing Lines
In Euclid, a line is a breadthless length. Moreover, a straight line is a line which lies evenly with the points on itself. This isn’t very helpful in the data visualization domain, where a user wants lines to have a breadth (possibly varying) and often join with other lines to make figures that are not just straight.
Drawing lines sounds like it should be an easy problem, but once you have a line with breadth that joins to other lines, it becomes difficult. There are a lot of possible options, corner cases, and performance trade-offs. In GeoJS, we had two methods for drawing lines, one of which had some capabilities that no other major library seems to have (more on this below). However, because of some bugs in this drawing method, lines that went around sharp corners rendered incorrectly. We draw individual line segments as well as polylines (both open and closed).
Initial State of GeoJS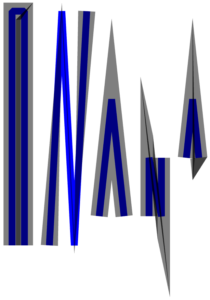
Prior to recent work, GeoJS could render lines in two ways:
- SVG elements is very slow. When used with more than 1000 line segments or so, the browser bogs down. We didn’t expose all of the features of SVG, just stroke width, color, and opacity.
- WebGL is fast, and can render 500,000 line segments while still maintaining an interactive frame rate. A feature that no other library has, GeoJS can vary stroke color, width, and opacity per vertex, so a polyline can widen and narrow, fade and come back, etc.
GeoJS has a couple of bugs:
(1) on sharp corners, we could fail to draw the line correctly.
(2) lines that overlap themselves do so inconsistently, sometimes doing odd things at the ends.
To offset these bugs, our renderer is quite fast and requires very little preprocessing. In a web browser, the limiting factor is often memory use — GeoJS needs 360 bytes per line segment.
In addition to fixing bugs, GeoJS users wanted some neat new features: support for line cap styles, line joins styles, adjustable miter limit, better antialiasing, and stroke offset support. The technical objective was to support all of the above features just as fast or faster than before.
How Other Libraries Draw Lines
Both SVG and the 2D canvas element render lines by generating a path that outlines the lines with the appropriate bevels, joins, and end caps. This path is then filled with the stroke color. This method has the virtue that a translucent line with multiple segments that overlaps itself will have a uniform transparency. In general, the WebGL implementations will have an increased opacity at the overlap. Both SVG and 2D canvas support a basic set of line caps and line joins, allow the miter limit to be set, and have some support for dashed lines.
Although one could generate a path and triangulate it to render lines in WebGL, no such method is known to have been implemented. Triangulation is a computationally expensive procedure, and since one of the goals of any program that chooses to code their own WebGL is to get speed, this method if eschewed in favor of rendering the lines more directly.
In WebGL, lines can be drawn either using one of the LINE, LINE_STRIP, or LINE_LOOP methods or using triangles. The drawback of the LINE* methods is that they provide very few options and are very dependent on the particular graphics implementation. The maximum width of the line is limited, and joins and end caps are not defined. Moreover, there is no ability to vary the line properties by vertex.
As a consequence, most libraries draw lines by using triangles. Simplistically, two triangles can be used to form a rectangle which is sufficient to cover each line segment, but practically this ignores the joins between lines and the end caps.
Most others libraries that use WebGL (see https://mattdesl.svbtle.com/drawing-lines-is-hard and https://www.mapbox.com/blog/drawing-antialiased-lines/) handle this by using many triangles per line. Rather than just two triangles, rounded end caps are composed of a group of triangles (see https://github.com/mapbox/mapbox-gl-js/blob/97bb3da617ce2b8377e7aa8d8b02b65834d7893d/js/data/bucket/line_bucket.js#L257-L284). Round joins are similarly groups of triangles. Beveled joins and miter joins also affect the triangles used. Constructing these triangles requires preprocessing the lines, some of which requires transforming the coordinates to the same orientation as the rendered result. The benefit of this preprocessing is that the vertex and fragment shaders can be relatively simple. If the lines don’t require complex geometries, the memory requirements are also lower.
New Method in GeoJS
In GeoJS, the goal was to have a fast line renderer that has a very short preprocessing time and lots of features. To minimize preprocessing time, rather than precomputing complex geometries for rounded line caps and joins, WebGL shaders need to perform most of the computations. Also, since as part of the roadmap to eventually support more 3D transforms, the full 3D data is sent to the shaders to avoid reducing information into 2D prematurely. This method has some memory penalty as sending 2D information along with precomputed angles and data would use less GPU memory. However, it has the benefit that the preprocessor does not need to know what transforms might be performed on the data, allowing the preparation step to be faster.
Each line segment is represented by two triangles. For each line segment, a geometry with six vertices and two triangles are passed to the shaders. For each vertex, data such as line width, color, opacity, stroke offset, and join or cap style are also passed as vertex data. Globally, a single miter limit and single antialiasing value (which some other libraries call blur) are set. So that the shaders have enough information, in addition to the vertices at either end of a line segment, on segments which join to others, the far vertex of the next segment is also included.
This means that, in general, the new method sends 4 vertices, 1 3-channel color, 1 opacity, 1 width, and 1 set of flags which includes the stroke offset and cap or join style at each end, for a total of 18 floats per vertex. The preprocessing consists of passing the correct values for each of these. There is one transform step for the vertices to convert from our internal coordinates to the map coordinates (often from latitude/longitude to web mercator, but not necessarily so).
The vertex shader does a fair amount of work. If the implementation had constructed a geometry of triangles in the preprocessing step, the vertex shader would have done no more than transformed the coordinates from the map reference frame to the screen reference frame. Instead, for line ends, the line is extended enough that the pair of triangles will cover the entire end cap. For line joins, the sine and cosine of half of the join angle are computed and used to extend the line so that it will cover the miter, bevel, clipped miter, or rounded join. This has to take offset and width into account. The join angle information, join style, cap style, offset, width, color, and opacity is passed on to the fragment shader.
The fragment shader determines which pixels to draw. If a pixel is beyond the end cap or outside of the join, it is discarded. If a pixel is on the far side of the miter line, it is discarded. If a pixel is near the boundary of the line, endcap, or join, it is antialiased.
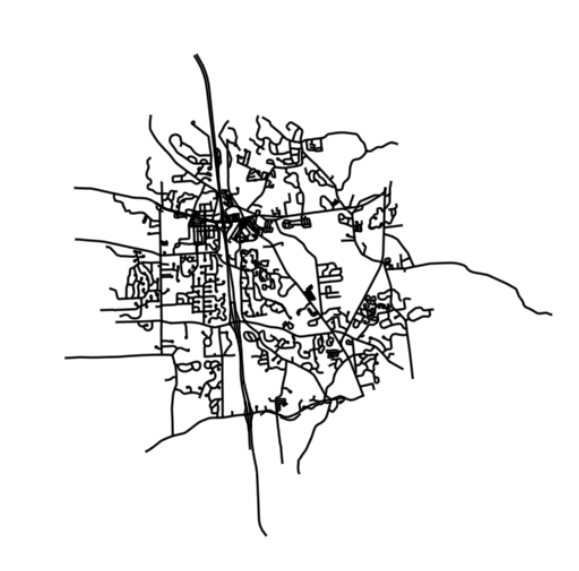
The result of this is light-weight preprocessing while still maintaining fast rendering. On a AMD FirePro W5000 graphics card, 500,000 line segments can be rendered at 60 fps (using lines that are mostly of 3 pixels in width). The maximum number of line segments that can be drawn by this card is around 2.4 million. Naturally, rendering slows down as the number of line segments goes up or if the area covered by line segments increases too far.
As part of the refactor, existing bugs were fixed, and support was added for:
- line caps: butt (default), round, and square.
- line joins: miter (default), round, bevel, and miter-clip (part of a proposed standard but not adopted by many other libraries yet)
- stroke offset: the line may range to the left or right of center, but must always include actual path between the two end points.
- adjustable miter limit (though it has to be the same for all line segments drawn as a single feature).
- antialiasing: a value of 1 or 2 makes the edges appear smooth. A large value blurs the line.
- very thin lines: before, lines thinner than 1 pixel generally looked bad.
There is a special debug mode that shows all of the pixels considered by the fragment shader, even if they are subsequently discarded. This helps determine what the shader is doing.
As part of testing comparisons, support was added for rendering on the 2D canvas. For both the 2D canvas and SVG line renderers, GeoJS now supports line caps, line joins, and miter limits, though these apply to all lines equally rather than having the ability to vary by vertex.
Comparison
See here for a web page comparing the new GeoJS line drawing options with other libraries and different rendering methods:
 Click on any demo to see a larger version of it. The non-WebGL version of Mapbox is not in the list, as it just uses Leaflet for line rendering, so the output looks no different from Leaflet.
Some of the other libraries support dashed lines and textured lines. Mapbox GL supports larger stroke offsets than we do.
Maximum numbers of line segments on a 2Mb AMD FirePro W5000:
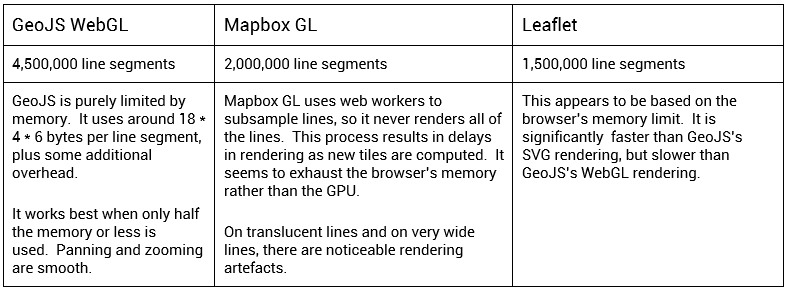
Limitations
The new line drawing technique has many features and is still fast. It does a better job than other libraries in visual quality for high-speed rendering, but not everything is perfect. Specifically, there are the following known issues:
- Varying widths and offsets –
When line width varies and there is overlap on wide lines, some of the joins are not correct. Simply, this error will always occur on a line with a close-to-zero length and different widths or offsets at each end. There is probably no correct solution to this, but the visual discontinuity that occurs could be improved. - Overlapping lines –
When a series of lines overlaps itself, the opacity at the overlap is greater than in non-overlapped areas. This is a different behavior than how SVG or Canvas line renderers compute the opacity. Since we allow opacity to vary per line segment, it isn’t clear how to change this behavior in a consistent way. - Short lines with acute angles –
When a short line meets a long line and the short line is shorter than the miter length produced by the join, an area along the long line near but not adjacent to the short line is not the full specified width. SVG and Canvas renderers fill this area differently. The difference is caused by rendering each line segment independently, and not considering pixels on the opposite side of the miter line. - Angular precision –
On very wide lines, especially on low-end graphics cards, the limited accuracy of sines and cosines in the GPU results in small artifacts at line joins.
Future Features
Below is a list of some additional desired features:
- Dashed lines –
Dashing specifications are well-defined, but it isn’t wholly clear what they mean in the context of variable width lines. (Please contact a GeoJS developer if there is a need or use-case of this feature.) - Textured lines –
Instead of filling a line with a color, it can be filled with a repeating texture. This allows a straightforward way to implement patterns, such as a line with bulges to indicate a weather front. As with dashed lines, the behavior when line width varies has to defined.
Acknowledgement
We are thankful to NASA’s Science Mission Directorate, NASA Headquarters for providing this opportunity.
Have a look at the following paper,
it basically does what you do and also adds nice dashing.
http://jcgt.org/published/0002/02/08/paper.pdf
Florian,
Thank you for the paper, it does look very interesting specially since we are looking to add support for dash lines. Do you happen to use lines / path rendering in your work.
Well, I was investigating to replace standard OpenGL line drawing in our software and I think the mentioned paper shows a nice way to do it without geometry shaders and with only little CPU preprocessing compared to other methods. It still has problems with overlapping lines, I think it is best to blend with max blending to an extra buffer to get that right, but hard to do with per vertex coloring.
Interesting — though we can vary the width (and other properties, like color and join style) per vertex, which that paper doesn’t address. Varying width makes this substantially more complex.