Introducing the Digital Signal Processing Plugin in ParaView
We are pleased to announce the new “Digital Signal Processing” ParaView plugin, or DSP plugin in short. It introduces some signal processing capabilities (mainly for processing acoustic data) and paves the way for making DSP easier and more efficient in ParaView. This plugin takes advantage of the recent Fast Fourier Transform (FFT) improvements in VTK as well as the already available `Plot Data Over Time` and `Table FFT` filters in order to be as complete and simple as possible.
For more technical information about the plugin, feel free to check the README and the documentation of the plugin.
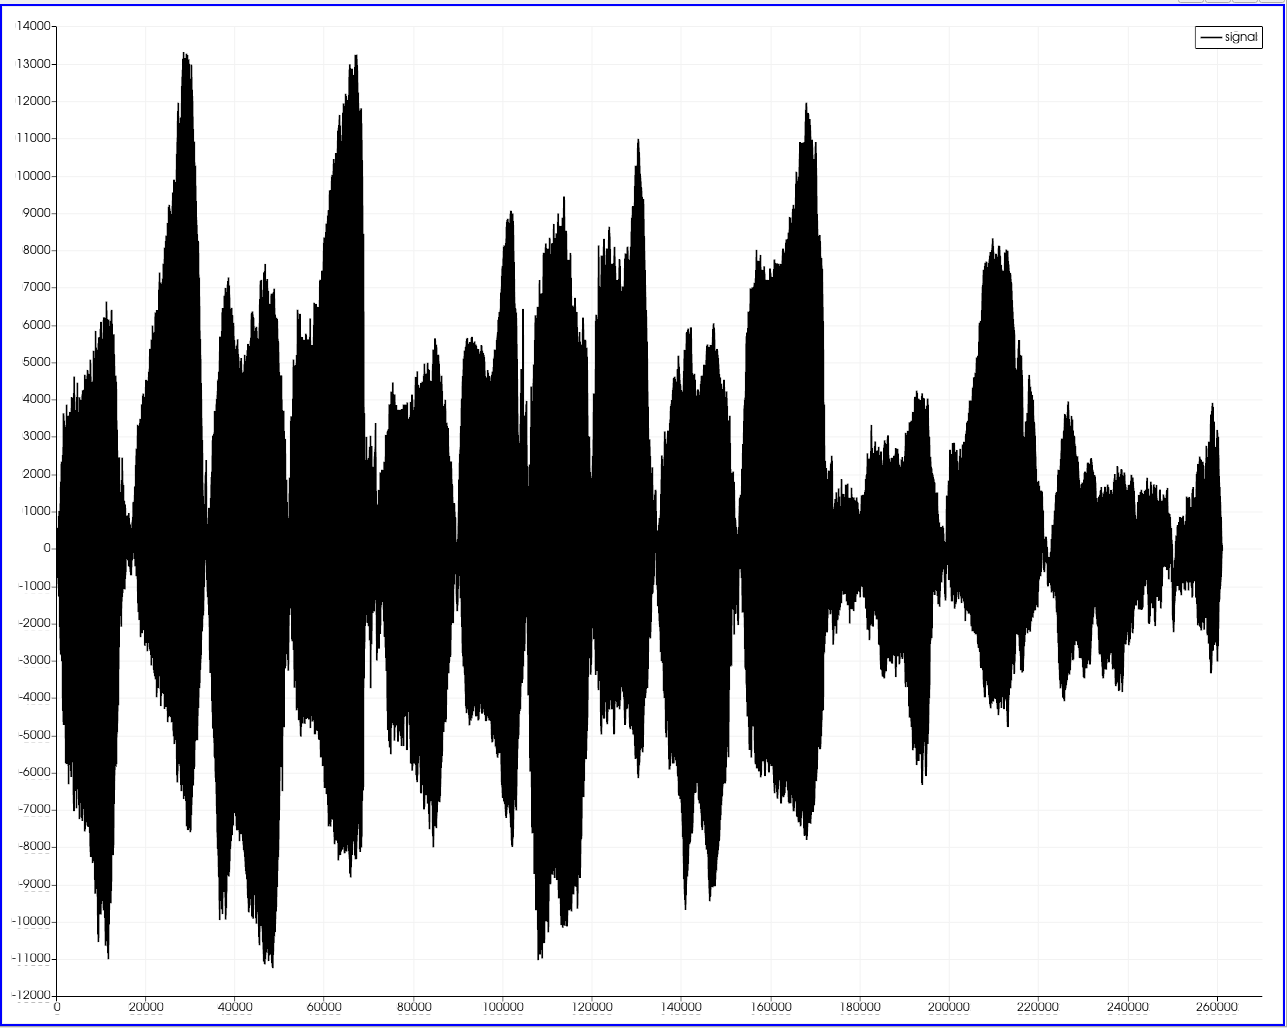
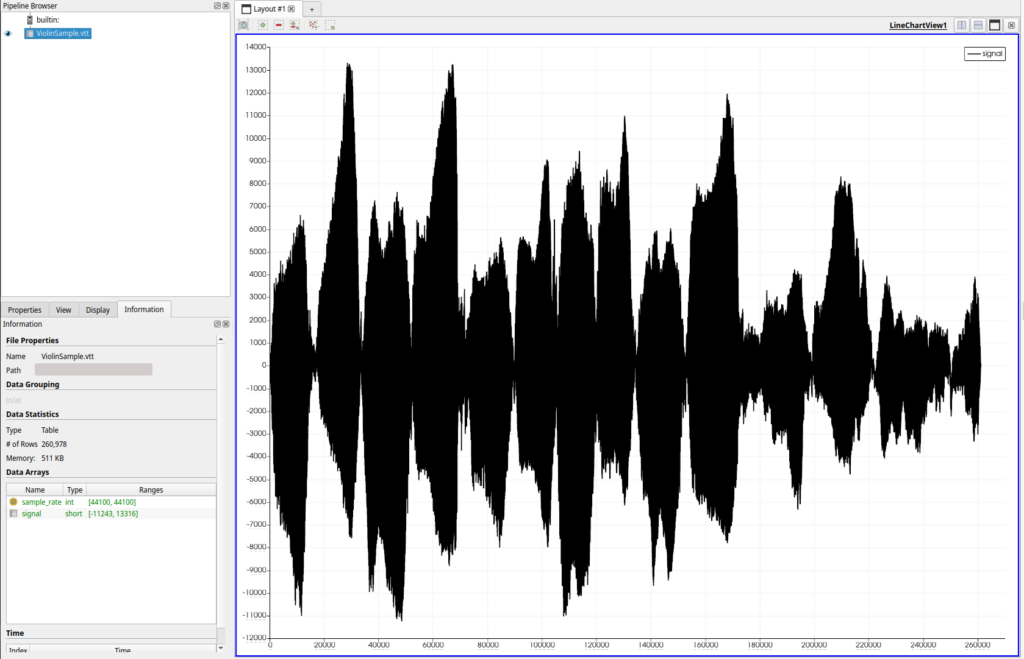
We will illustrate the new filters introduced by this plugin with two datasets : the first one is a temporal point cloud representing measurements of the pressure on the surface of a high speed train (TGV), and the second is the recording of a violin.
New Filters
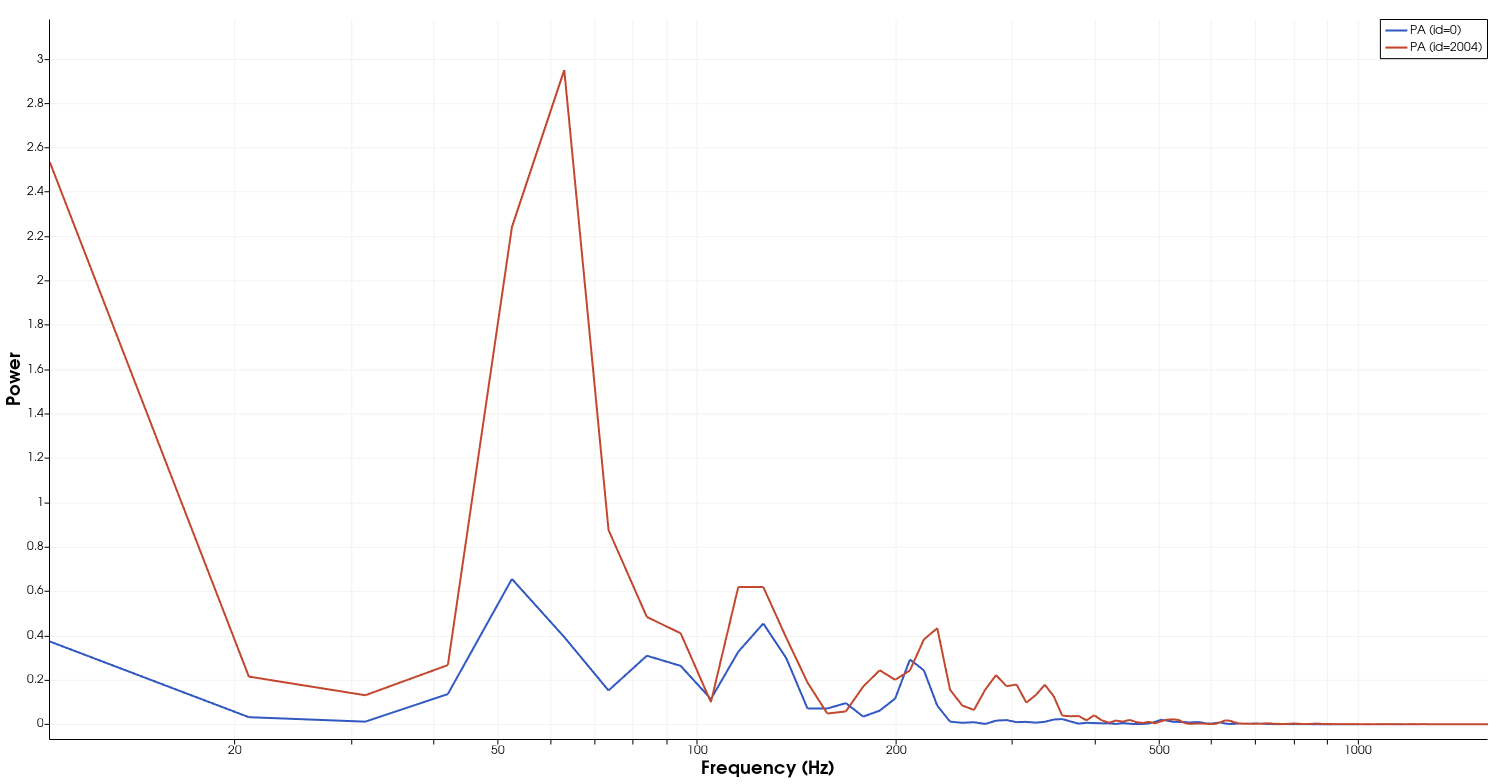
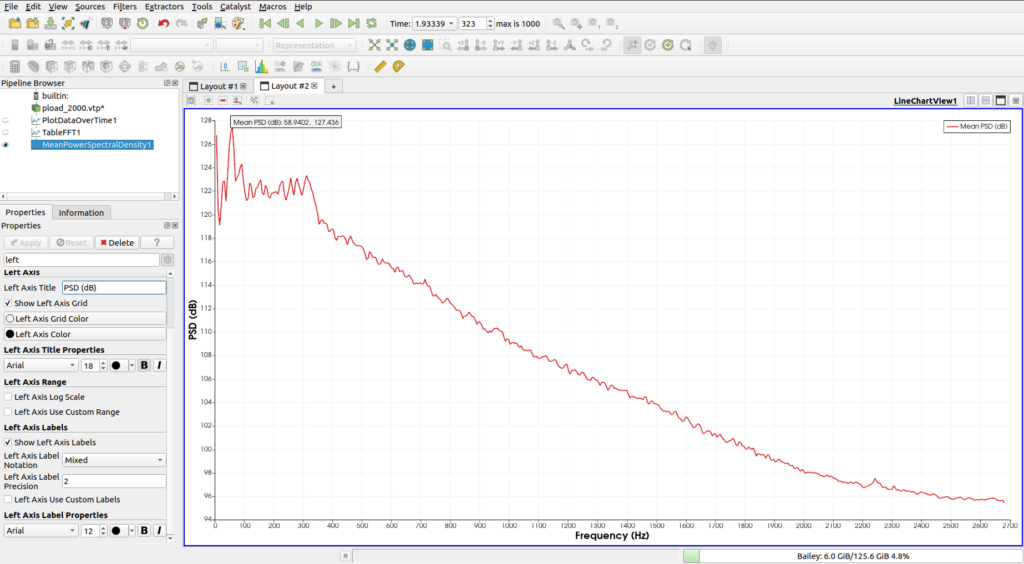
Mean Power Spectral Density
This filter computes the mean power spectral density given multiple Fast Fourier Transforms (FFT) for some points. These FFTs can be computed using the Table FFT filter and are stored in a multi-block.
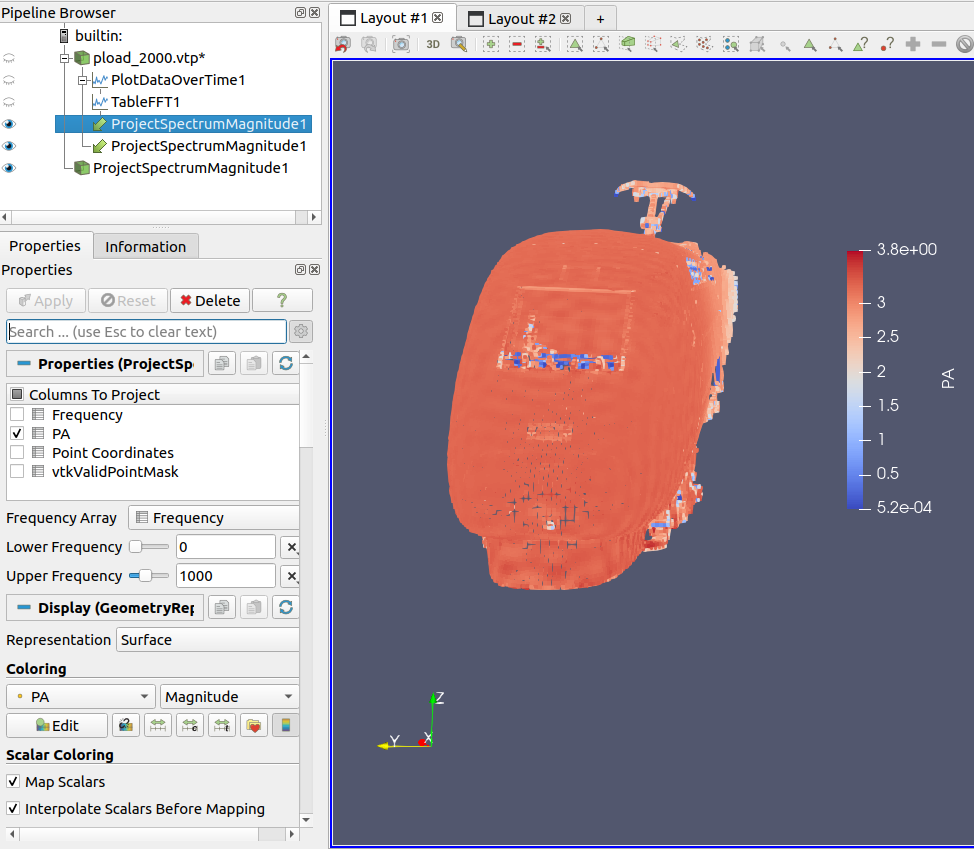
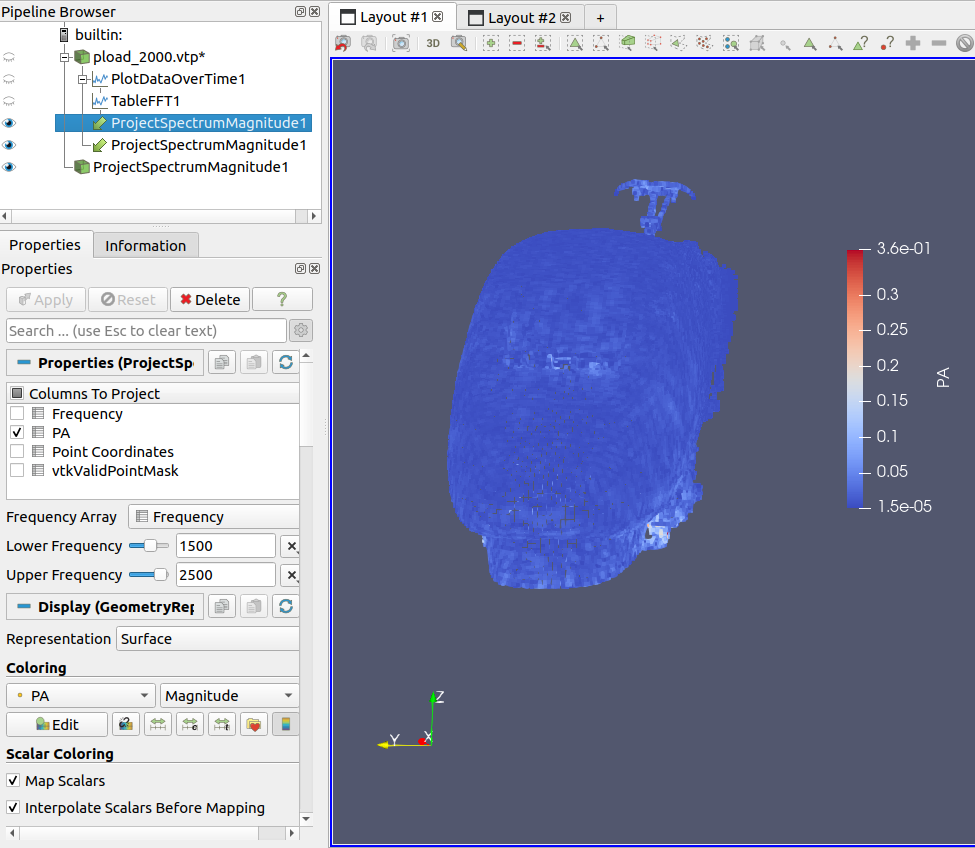
Project Spectrum Magnitude
Given a geometry and the FFT for each point, the filter reprojects on the geometry the magnitude of the signal for a user-specified frequency range. The FFTs are stored in a multi-block of tables and are passed as a second input.
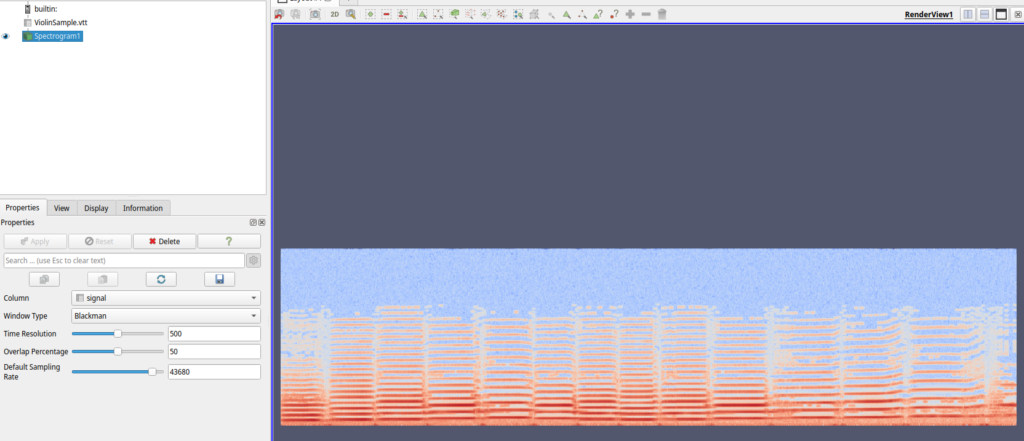
Spectrogram Filter
Given a signal contained in a vtkTable, the filter computes the spectrogram of that signal. Users have access to parameters such as the window type, the time resolution and the overlap between each window when computing the spectrogram.
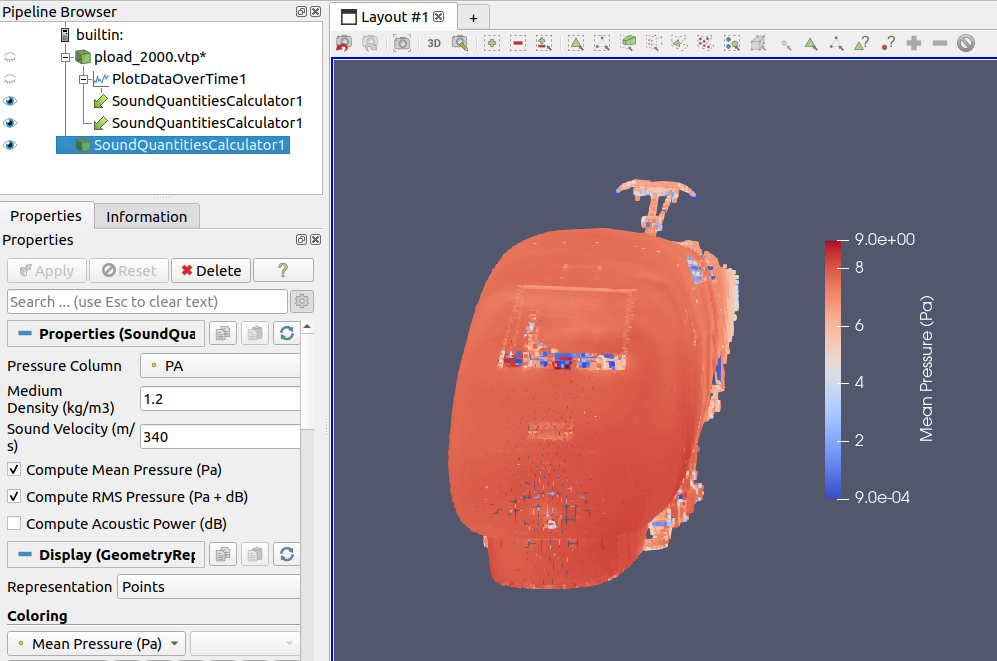
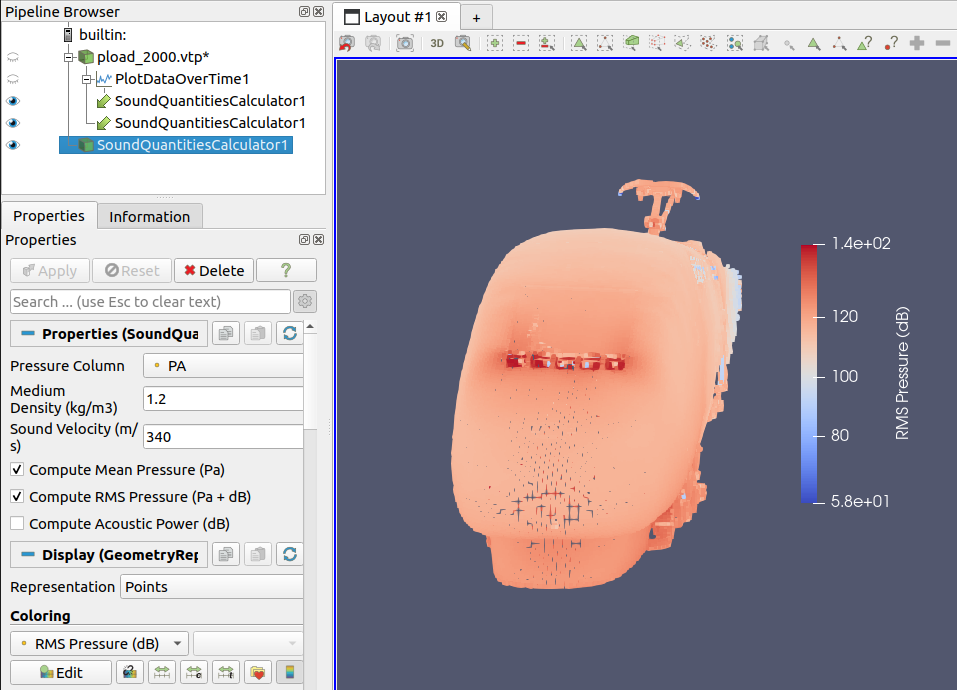
Sound Quantities Filter
Given a temporal dataset the filter computes, for each point, the Root Mean Square (RMS) value of the scalar field and reproject it on the mesh. It can also computes the average acoustic power on the whole surface when a surface is available.
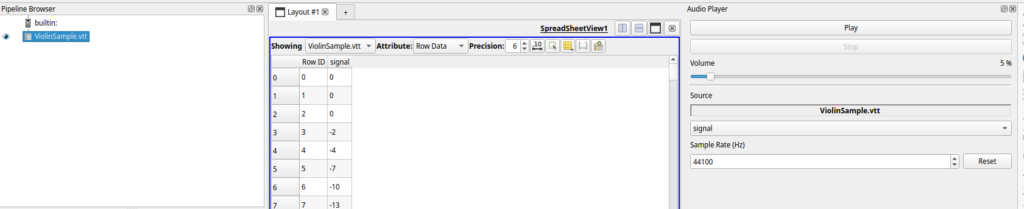
New Audio Dock Widget
The plugin also comes with a new dock widget called Audio Player. This dock allows you to listen to signals stored into tables directly from the ParaView GUI. You can choose which column to listen to, and at which volume and sample rate. When possible, the sample rate will be retrieved from the sample_rate field data. In the future the sample rate will also be retrieved using the Time column if one is found.
Challenges and future development
While the current version of the plugin in the master of ParaView is stable, there are still some possible improvements that we are currently working on :
- Data structure : the VTK pipeline is very robust and efficient for large datasets, but has more limitations when dealing with temporal datasets. To solve this issue we currently use multiple tables stored in a multi-block in order to store the whole data for every point at every timestep. The problem with this approach is that it is highly inefficient when distributed across several MPI ranks. We already have a specific solution for this issue and hopefully we’ll be able to integrate it during the current year.
- Plotting data : When dealing with this kind of data, it is often displayed in charts instead of the render view, and we can’t ignore that the chart framework of ParaView is less mature than the render view. We have already improved some interactions, and plan to continue !
- Better performance : some of these processes are highly parallel and some could benefit from a MPI and/or GPU implementation.
Acknowledgement
This work is funded by the CALM-AA European project (cofunded by the European fund for regional development).

Datasets and help about implementation has been provided by MicroDB.

Help with reviews and datasets has been provided by KM Turbulenz Gmbh