ITKWidgets and NCI Imaging Data Commons (IDC): Intuitive visualizations and cloud resources for medical imaging research
We are pleased to announce the integration of the visualization capabilities of ITKWidgets with the massive collection of clinical data in the NCI Imaging Data Commons (IDC). This work was a collaboration between Kitware, the National Cancer Institute, and Brigham and Women’s Hospital. As demonstrated in the IDC’s Getting Started and deep learning (Segmentation Primer) jupyter notebooks, integrating ITKWidgets’ visualizations with IDC’s data handling and AI workflows creates a streamlined research experience, facilitating the discovery of new insights and improved results. Furthermore, the visualization capabilities of ITKWidgets are not limited to IDC data. They can be utilized in any jupyter notebook running on Macs, Windows, Linux, Google Colab, or Amazon Sagemaker Studio. They are available now in a pre-release version of ITKWidgets via the pip command with the –pre option. Details and highlights are given next.
Background
The IDC is a part of the Cancer Research Data Commons’ (CRDC) initiative to provide a cloud-based centralized repository of “AI-ready” medical imaging data from various sources, including academic research centers, clinical trials, and industry partners. The IDC aims to enable researchers of varying expertise to easily access and explore imaging data, which makes ITKWidgets the perfect complementary tool!
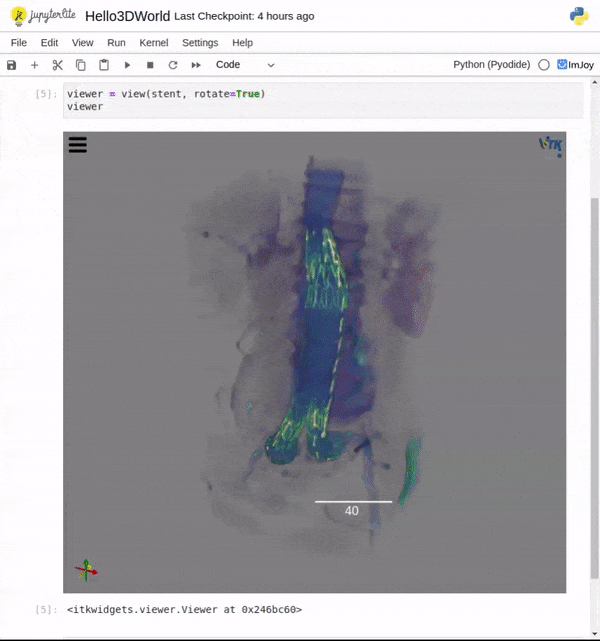
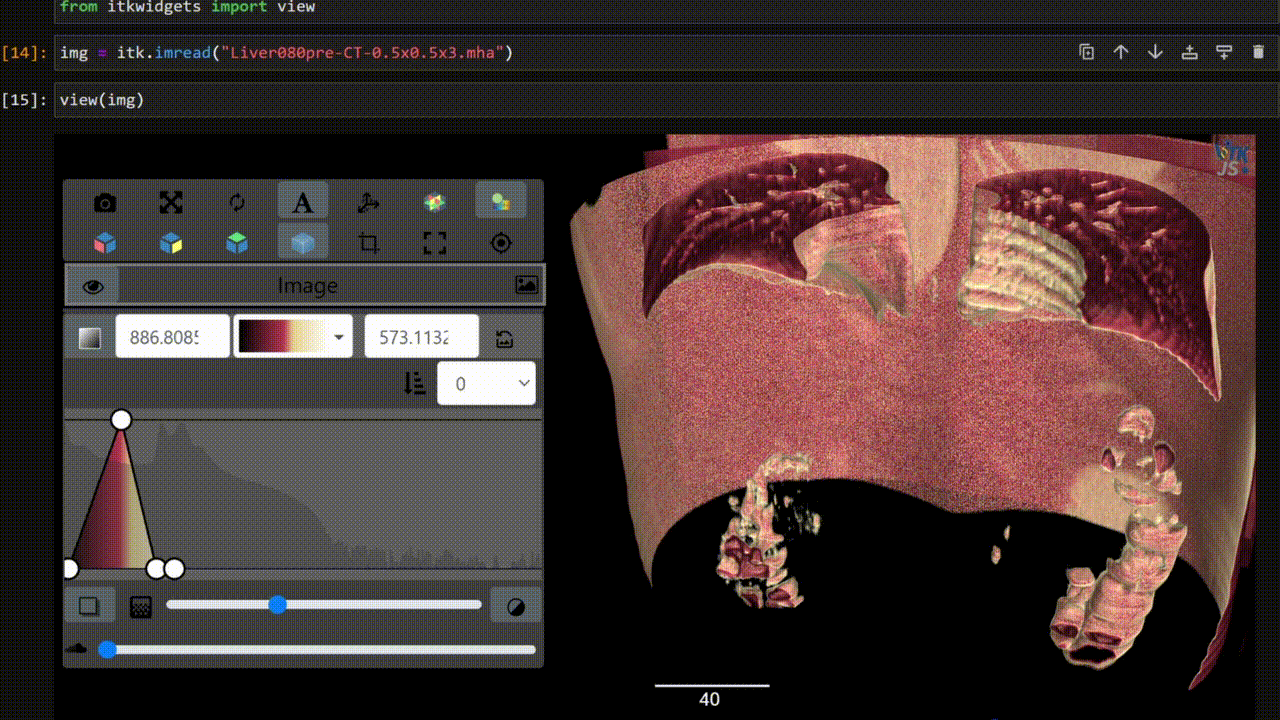
ITKWidgets is a Python package that provides high quality, interactive visualizations that run directly within Jupyter notebooks. They allow users of all skill levels to quickly inspect and manipulate data and processing results within their workflows, without having to interrupt their focus or switch to other applications.
Features
During our collaboration, we received invaluable feedback, feature requests, and bug reports from students and researchers involved in this project and actively using IDC data with ITKWidgets in their own work. This hands-on information allowed us to rapidly improve the overall ease of use and capabilities of ITKWidgets during our collaboration.
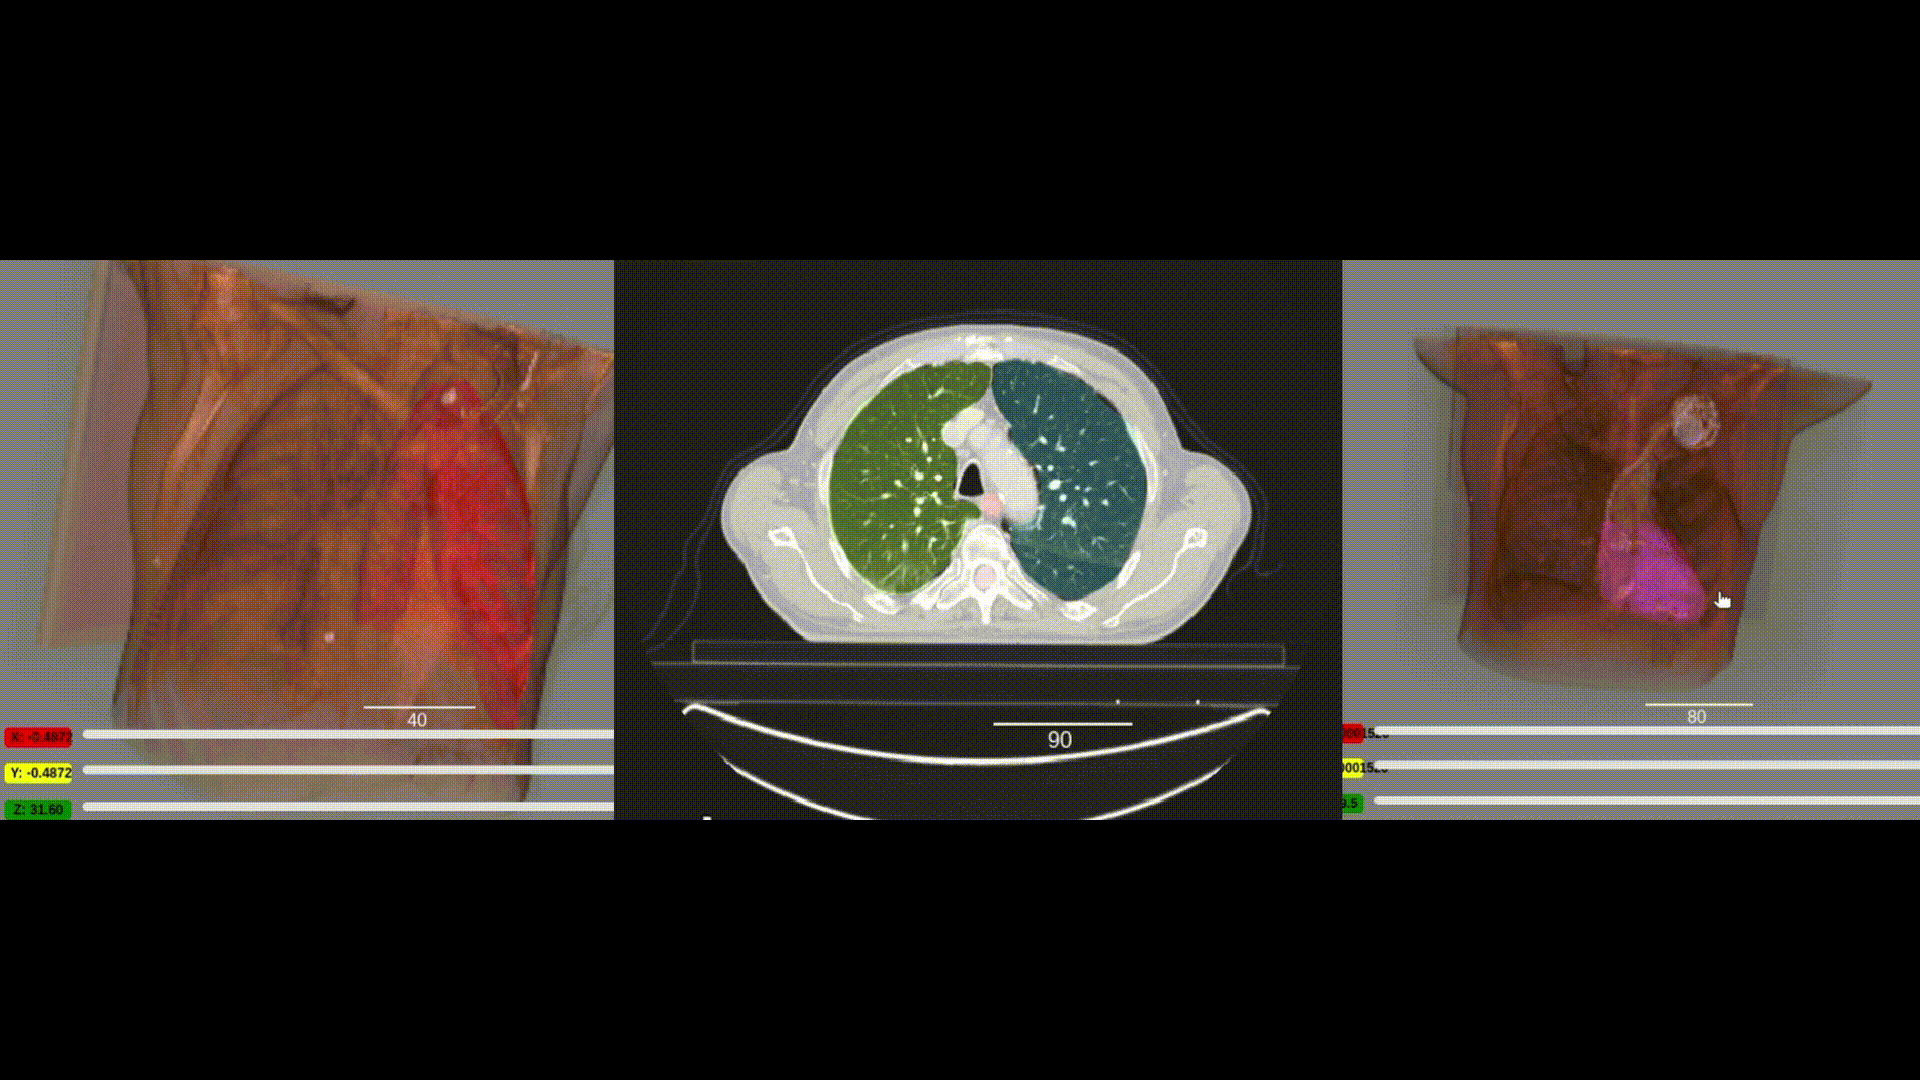
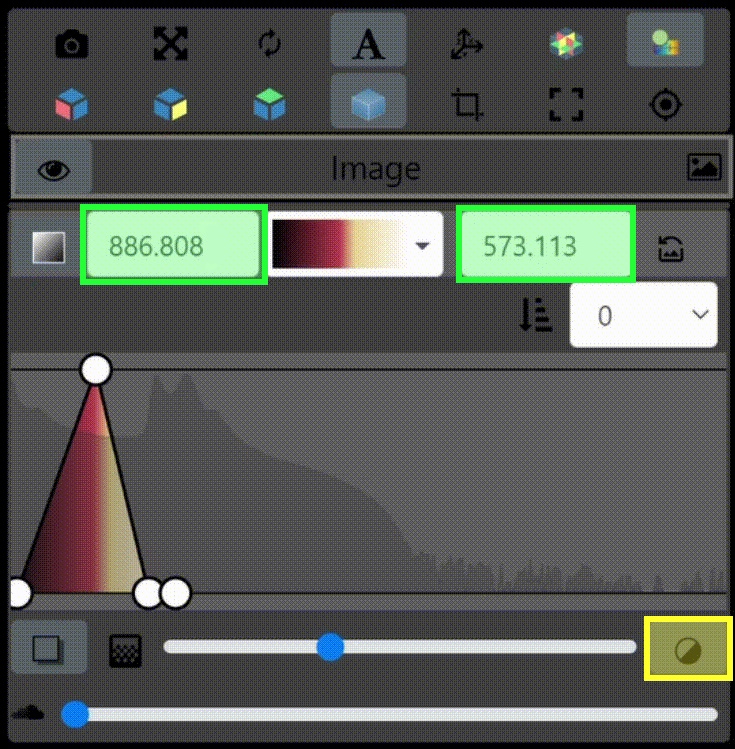
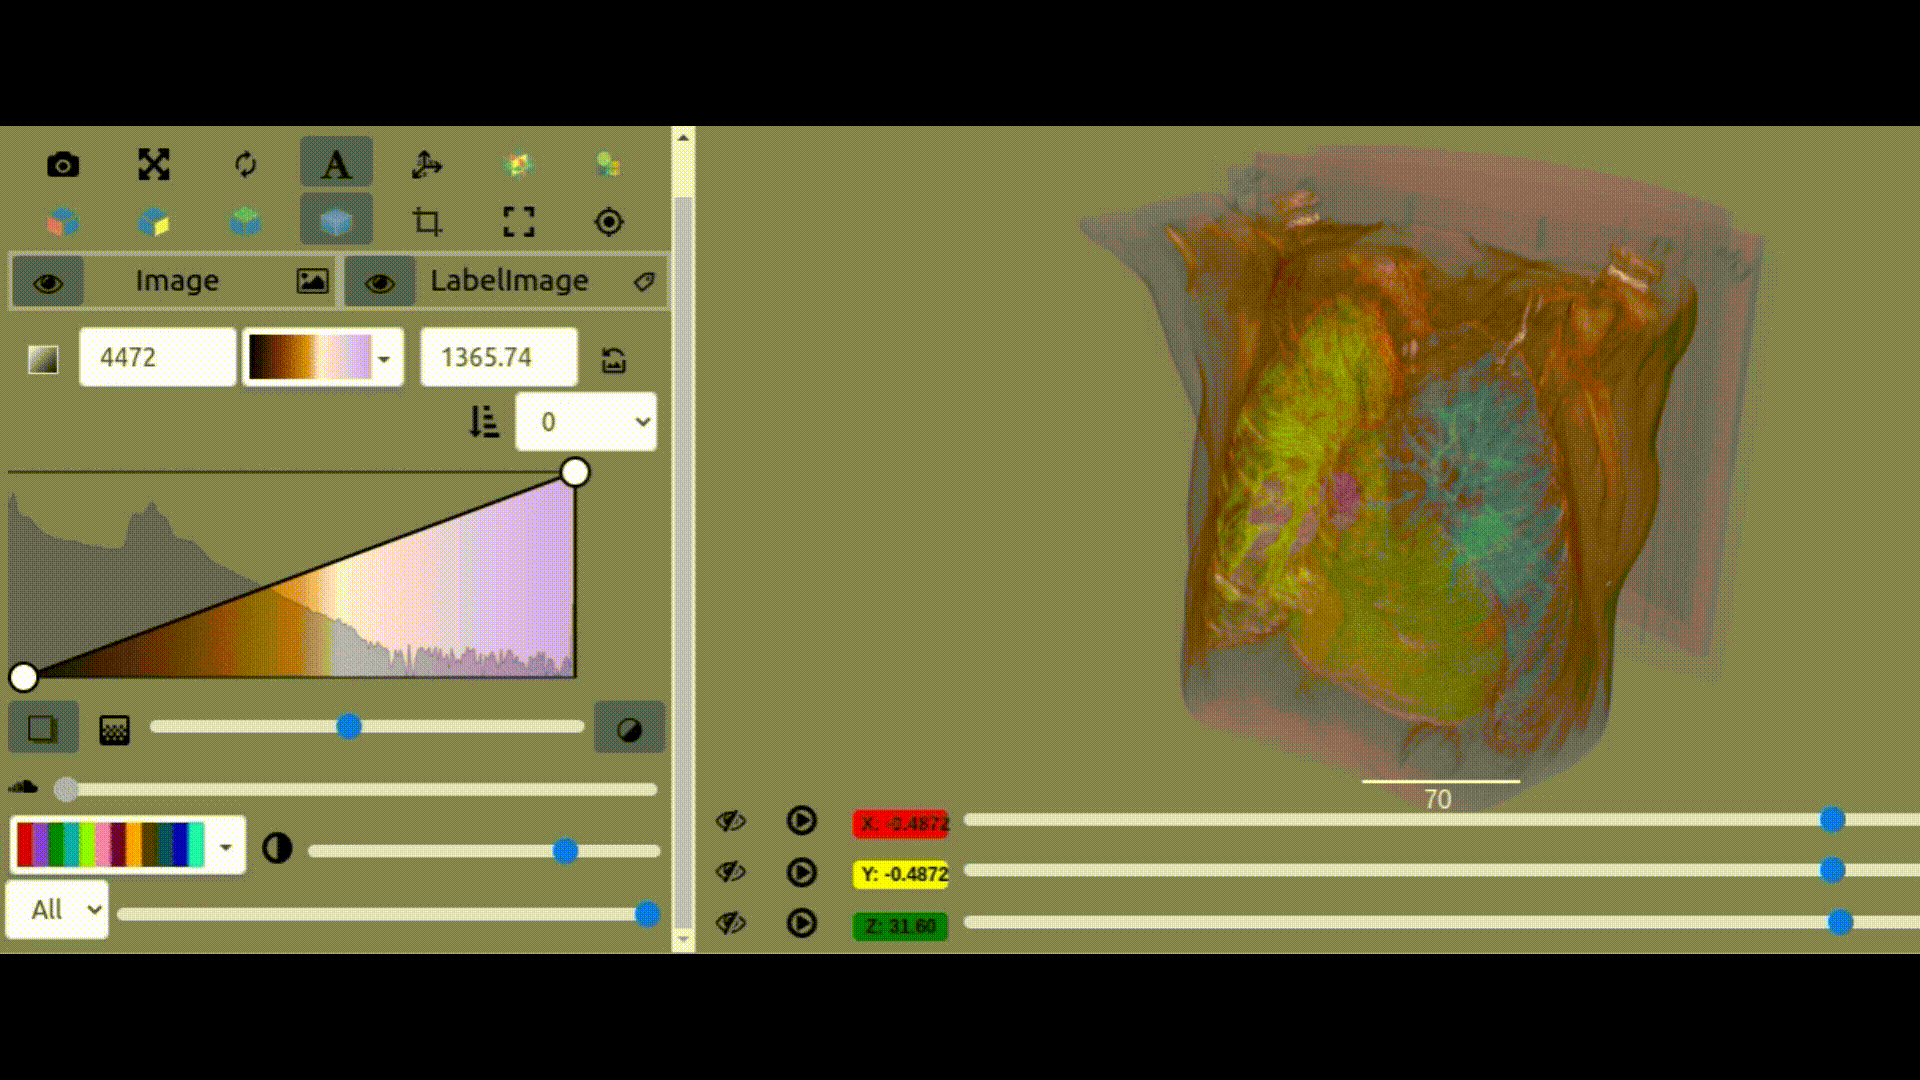
One key new feature is a more intuitive and powerful system for window width and level manipulation. In the world of medical image visualization, the ability to set the window width and level, which maps recorded to displayed intensities and is commonly referred to as windowing, is particularly useful. This allows radiologists to adjust the appearance of the image they are viewing to highlight structures of interest. The new ITKWidgets window/level interactivity provides an experience expected by radiologists when using a radiological viewer, but it also extends that capability to support arbitrary colormaps (not just grayscale), complex opacity functions, and 3D as well as 2D visualizations. As shown in the lower left in the video below, itkWidgets displays a histogram of an image’s recorded intensities and a combined color and opacity transfer function is overlaid. The height of the function and the color under the function at each recorded intensity position defines how that recorded intensity is displayed in 2D and 3D.
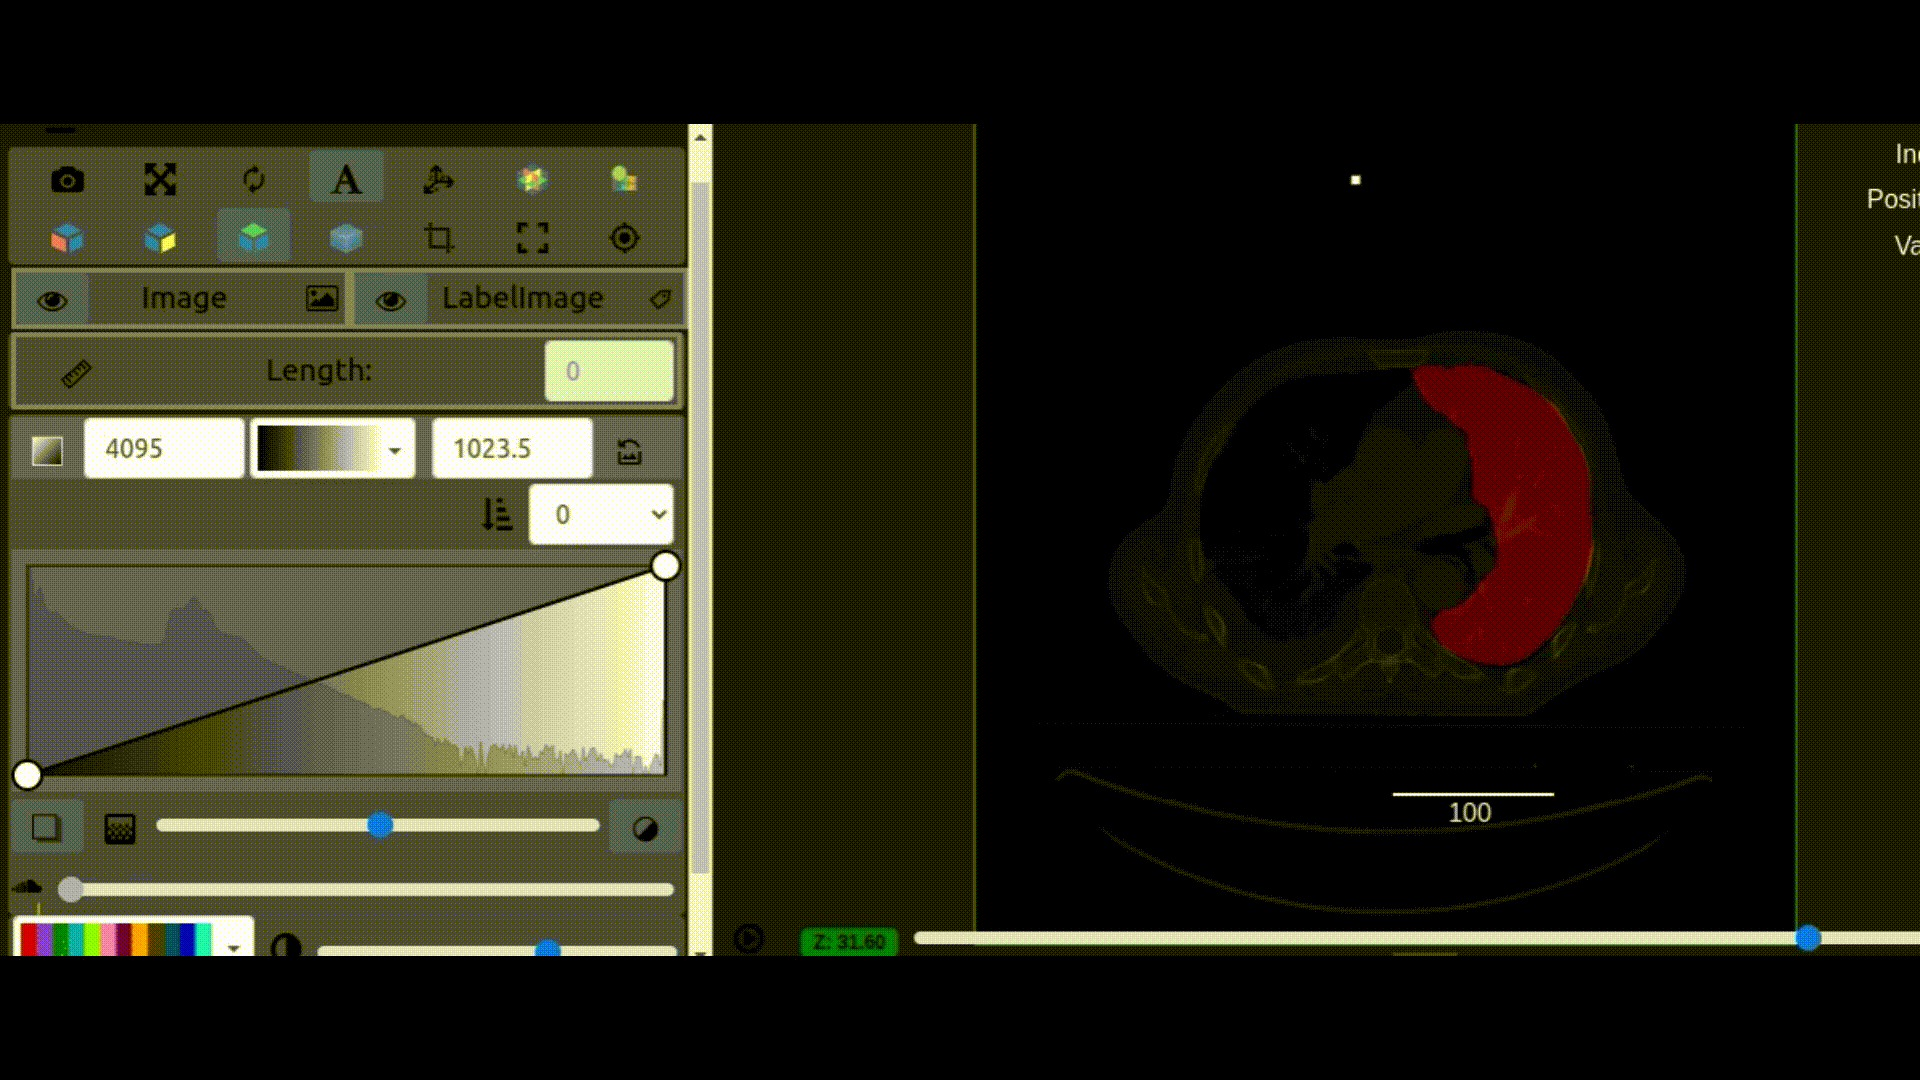
Within ITKWidgets users can toggle its window/level feature on or off with the black and white circle icon underneath the transfer function widget. When this feature has been toggled “on”, users can then left-click and drag the mouse up and down to change the window level or left and right to change the window width. Additionally, users can manually enter specific window/level values in the numeric fields located above the histogram. users can also quickly undo changes using the reset button located to the right of those numeric fields. See the figure below.
Other new features include improved image and labelmap blending functions, stable support for Google Colab and Amazon Sagemaker Studio cloud notebooks, and the ability to handle large images thanks to an improved, multi-scale, data streaming protocol between the webpage visualization and the notebook’s python kernel server.
Additional information on these and other features is available in the ITKWidget documentation: https://itkwidgets.readthedocs.io/en/latest/
Summary
By providing interactive widgets for visualizing and exploring 3D images, ITKWidgets makes it easier to understand the complex data that medical professionals rely on. And by supporting window width and level adjustments, ITKWidgets helps users identify important details that might otherwise be missed. When combined with platforms like IDC and the MONAI open source medical image artificial intelligence library, ITKWidgets can accelerate the pace of important research that can improve patient outcomes and advance the field of medical imaging.
Try it Yourself
The IDC platform for sharing and accessing medical imaging data, combined with the inline, interactive visualizations provided by ITKWidgets is a great example of how open source initiatives can work together to lower barriers and simplify medical imaging research. To try quickly iterating on 3D analysis of open IDC datasets, start with the example notebook that demos some of the data shown in this post, or try the updated tutorials or the ITKWidgets examples.
Acknowledgments
Research reported in this publication was supported, in part, by the National Institute Of Biomedical Imaging And Bioengineering, the National Institute of Neurological Disorders and Stroke, and the National Institute of Mental Health at the National Institutes of Health, under Award Numbers R01EB028283, R01EB014955, R42NS086295, and 1RF1MH126732. IDC has been funded in whole or in part with Federal funds from the NCI, NIH, under task order no. HHSN26110071 under contract no. HHSN261201500003l. The content is solely the responsibility of the authors and does not necessarily represent the official views of the National Institutes of Health.