ParaView 5.6.0 Release Notes
ParaView 5.6.0 Release Notes
Major changes made since ParaView 5.5.2 are listed in this document. The full list of issues addressed by this release is available here.
General Notes
State file compatibility with ParaView 4.2
State files from ParaView 4.1 or earlier are no longer supported. To update state files from ParaView 4.1 or earlier, please use ParaView 5.5, open the state file, then save a new copy of the state file. The saved version will be readable by ParaView 5.6.
Community
ParaView community support has moved to http://discourse.paraview.org. The archives of the mailing lists paraview@paraview.org and paraview-developers@paraview.org will be preserved, but no new emails to these lists will be accepted.
New Features
Added a “Reset Display Empty View” setting
Available under the General settings tab, the new Reset Display Empty View setting controls whether to reset the camera in a render view when showing a representation in a previously empty view.
Previously, ParaView always reset the camera in the view. The default setting value keeps it this way, but it is now possible to disable that behavior to preserve the camera view.
Annotations automatically initialized when categorical coloring is enabled
ParaView will now attempt to automatically initialize colors and annotations when the Interpret Values as Categories setting is enabled for a color map. It will determine the categories from the currently selected source in the Pipeline Browser. If unsuccessful, ParaView will report an error.
Connection server timeout
A control for setting the timeout to use when connecting to a server has been added to the Choose Server Configuration dialog. In Python, a timeout parameter has been added as an optional parameter to the different Connect methods.
Filter changes
Improved ability to add Python-based algorithms via plugins
Support for developing filters, readers, writers in Python and distributing them as plugins has been improved. paraview.util.vtkAlgorithm module provides decorators to expose VTKPythonAlgorithmBase-based VTK algorithms in ParaView. A Python module that provides such decorated algorithms can now be directly loaded in ParaView as plugins.
Added molecule filters
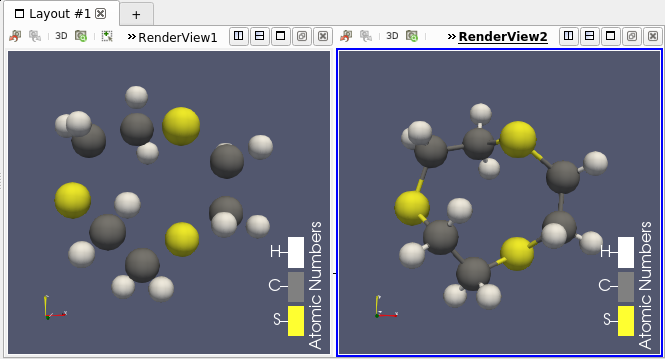
Several filters that involve Molecule data sets have been added:
- a simple bond perceiver (that also operates in parallel) (Compute Molecule Bonds)
- a converter from point set to Molecule data set (Convert Into Molecule)
- a converter from Molecule to Polygonal Mesh (Molecule To Lines)
- a filter to append one or more molecules into a single one (Append Molecule)
 |
|---|
| A molecule (left) and the same with computed bonds (right). |
Added point distribution filter
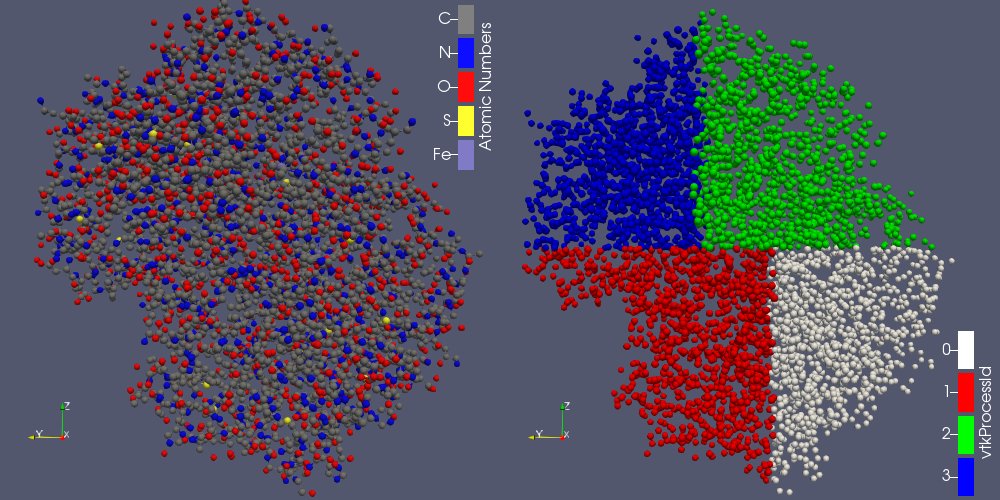
To complement the new Molecule data set filters, ParaView now has a filter named Distribute Points that distributes point sets over MPI processes.
 |
|---|
| A molecule (left) distributed over 4 processes (right, colored by process Id). |
Revised Glyph filter
The Glyph filter has been revised with more meaningful properties, and a streamlined user interface. Care has been taken to provide backwards compatibility for state files saved from and Python scripts developed for ParaView versions 4.2 and later.
 |
|---|
| The improved user interface of the Glyph filter. |
AMR Slice Filter Fixed
- A bug that resulted in incorrect slices has been fixed.
- The user interface has been simplified.
Ghost Cells Generator fixes
The Ghost Cells Generator filter was fixed to work in non-MPI builds, and a bug for bad partitions was corrected.
Moment invariants
Added moment invariants filters from the VTK remote module. These filters are available only if the CMake option Module_vtkFiltersMomentInvariants is enabled when configuring ParaView. The filters available are Compute Moments, Parallel Compute Moments, and Moment Invariants.
The theory and the algorithm are described in Roxana Bujack and Hans Hagen: “Moment Invariants for Multi-Dimensional Data”
Developed by Roxana Bujack and Karen Tsai at Los Alamos National Laboratory.
Aggregate Dataset filter handles regular grid data sets
The Aggregate Dataset filter now works with image data, rectilinear grids, and structured grids whereas before it only worked with polydata and unstructured grids.
Extracting solid geometry from CTH files
The Extract CTH Parts has been augmented with an option that enables extraction of CTH parts as 3D cells, not just 2D contours.
Bounding Ruler can now measure axes along oriented bounding boxes
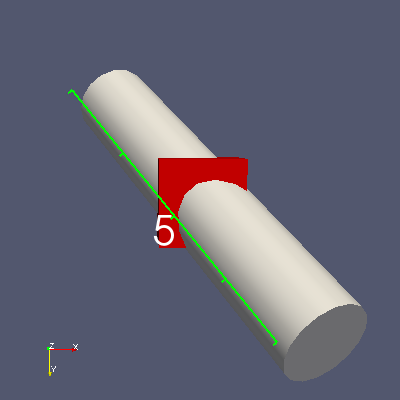
In addition to measuring the X, Y, or Z axis of the axis-aligned bounding box of a data set, the Bounding Ruler filter can now measure the Major, Medium, and Minor axes of the data set’s oriented bounding box. These axes are new options in the Axis property of the Bounding Ruler filter. As an example, one can use ParaView’s selection capabilities to extract two points of interest and then apply the Bounding Ruler with the Axis property set to Oriented Bounding Box Major Axis to measure how the distance between these points changes over time. Read more…
One caveat to these options is that all the points in a distributed data set need to be copied to a single rank to compute the oriented bounding box. When used in a parallel server setting, this may be slow or lead to memory exhaustion if the data set does not fit onto one rank.
 |
|---|
| Measuring the length of a rotated cylinder object along its oriented bounding box major axis. |
MooseXfemClip Plugin
The MooseXfemClip filter has been added as a plugin to aid in the visualization of results produced using the XFEM module in the MOOSE framework developed at Idaho National Laboratory.
The MOOSE XFEM implementation uses a phantom node approach to represent discontinuities in finite element solutions, which results in overlapping finite elements. The MooseXfemClip filter clips off the non-physical portions of the overlapping elements, allowing correct visualization of the discontinuous fields produced by this method.
Readers, writers, and sources
MultiBlock Reader Variable Selection
The multiblock file reader now reports the available point, cell, and field attributes of the dataset, and supports selective loading of them based on user selection.
Series file (.series) format supports more file formats
JSON description files for time series can now be written for these additional file formats:
vtm, vtmb, vthb, vth, vtp, vtt, vtu, vti, vtk, vts, vtr, pvtp, pvtu, pvtt, pvti, pvts, pvtr, pvtk, ply, stl
The name of the series file must follow the format <filename>.<format>.series, e.g., images.vti.series. More information about the content of the file can be found here.
Tecplot reader
The Tecplot reader was improved to handle the ZONETYPE parameter.
SEG-Y reader
A reader for 2.5D and 3D SEG-Y data files is now available. Read more…
MotionFX CFG files readers
ParaView includes a reader to read MotionFX CFG files that describe various types of motions on STL geometries. The reader can animate the geometries as described in the CFG file without having to re-read the geometry files on each timestep.
Gmsh Reader Plugin
ParaView has a reader for visualization of high-order polynomial solutions in the Gmsh format.
Wavefront OBJ reader
The Wavefront OBJ reader retains OBJ groups as GroupIds for faces (similar to STL solid-labelling). This allows extraction of sub-geometries based on their group.
Wavefront OBJ writer
It is now possible to save PolyData meshes to the OBJ file format. The written files contain geometry including lines, triangles and polygons. If present, normals and texture coordinates on points are also written.
CGNS writer added
A CGNS Writer has been added that supports writing structured, unstructured and polygonal datasets, and multi-block datasets thereof.
HyperTreeGrid source
A new source for generating random vtkHyperTreeGrid structures has been added under Sources -> Hyper Tree Grid (Random). It supports deterministic seeding and MPI-parallel execution.
The XML writer for vtkHyperTreeGrids now properly outputs appended data arrays.
Several of the vtkHyperTreeGrid filters were exposed, including:
- Plane Cutter
- Depth Limiter
- Cell Centers
- Axis Reflection
- Axis Cut
- Axis Clip
Live Programmable Source
To support use cases where one wants to develop a programmable source that is automatically refreshed periodically, we have added Live Programmable Source. With this source, one can provide a Python script for CheckNeedsUpdateScript that can indicate that the source may have new data and hence should be updated. The ParaView client application can periodically check such sources and update them, if needed.
Fast Uniform Grid source
To enable testing ParaView with large image data sets, the Fast Uniform Grid image data source as been added. This source generates point data fields with simple, fast-to-compute functions.
Test data source for plotting global variables
Added a Python plugin that acts as a test data source for data sets with global temporal data made for testing the ParaView module “Plot Global Temporal Data”. The plugin creates a MultiBlockDataSet with a dummy uniform grid (vtkImageData). Multiple global data arrays are added based on provided input parameters
- Number of time steps in the temporal data.
- Number of global data arrays.
- A value offset that shifts the origin of all generated data arrays.
Interface Improvements
Python Shell and Output Window respect font size setting
The size of the font in the Python Shell and Output Window now follow the Font Size setting under the General settings tab in the Settings dialog.
Customizable shortcuts
ParaView now provides customizable keyboard shortcuts for menu items. Shortcuts can be set through a dialog box accessed from the Tools -> Customize Shortcuts… menu item.
Custom Viewpoints Toolbar
Controls for managing custom viewpoints have been improved. These controls are accessible by clicking the Configure… button in the Adjust Camera dialog. A toolbar with buttons for each custom viewpoint provides fast access to custom viewpoints.
Favorites for filters
Favorites for filters are a set of custom menu items intended to provide fast access to often-used filters. The Favorites Manager enables creation and arranging bookmarks under an arbitrary number of levels of custom categories. Favorites are accessible under the Filters menu. In addition, the pipeline context menu contains an Add current filter menu item as a convenience.
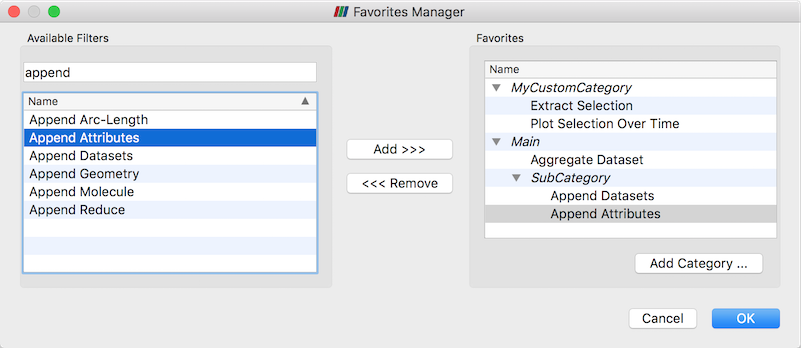 |
|---|
| The new Favorites Manager. |
Improved widgets used to view and edit real-number properties
New application settings Real Number Displayed Notation and Real Number Displayed Precision enable control of how real-number properties are displayed in the ParaView client user interface. These settings control how the property values are displayed, but the actual property values are stored in full precision. Regardless of the real number display settings, the full precision text is displayed when editing the property.
Improved time display options
A new feature adds an Animation Time Notation setting offering the options Scientific, Fixed, or Mixed, and an Animation Time Precision controlling the number of significant digits displayed. The Time display is automatically updated when settings (precision or notation) change.
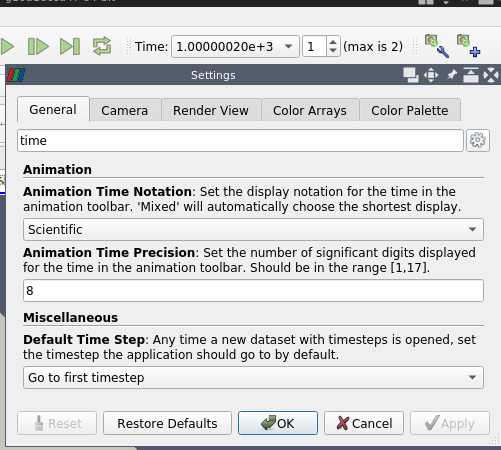 |
|---|
| Time display settings allows to choose notation and precision. |
Faster precise time selection
When the animation mode is set to Snap to timesteps in the Animation View, the available times in the Current Time Controls are available in a popup menu, so switching to a specific time is easier and faster.
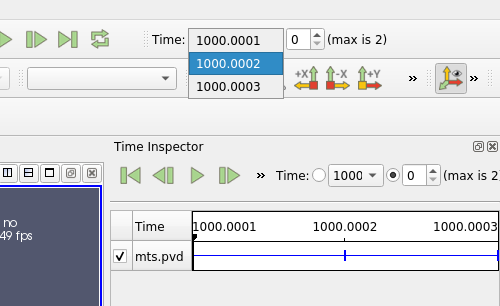 |
|---|
| The drop list provides an easy access to specific time. |
Redo command keyboard shortcut changed from Ctrl-R to Ctrl-Y
Ctrl-Y (or Command-Y on macOS) is a common keyboard shortcut for the redo command in many applications, so we have made it the same in ParaView. In addition, we added a keyboard shortcut (Ctrl-R or Command-R on macOS) for the Reset Session command to the Edit menu entry.
Zoom in and out buttons in the Adjust Camera dialog box
The Adjust Camera dialog now includes buttons labeled “Zoom In” and “Zoom Out” for manipulating the camera zoom level. The zoom factor can be set to control how much zooming in or out is done.
Changes to the Choose Preset dialog
The Choose Preset dialog now has 16 default color maps and an advanced button that, when clicked, displays the full list. Limiting the number of color maps displayed by default aims to avoid presentation of an overwhelming number of colors in the full list and to encourage use of color maps with good perceptual properties. It is also possible to promote non-default color maps to default status by clicking the Show current preset in default mode checkbox on the right side of the dialog box. Read more….
Group source generators by category
The source generators in the Source menu have been organized into Annotation, Data Objects, Geometric Shapes, and Measurement Tools categories. All sources are available in the Alphabetical category.
Selection in the Point Gaussian representation
Points selection now works with the Point Gaussian representation.
Optional rescaling of log plots with negative data values
When creating a 2D plot of data and enabling log scaling on the left or right axis, a warning would appear if the plotted data had negative values explaining that the log of a negative value is undefined. ParaView now has an application setting to bypass the negative log axis warning by instead clipping the axis range to show only log-scaled positive values when log scaling is active.
zSpace support
zSpace devices are now configurable through a zSpace configuration file (.pvx). Examples of .pvx files are now located in the Examples/VR directory in the ParaView source directory. Additionally, camera angles have been synchronized between the Paraview client and zSpace screens.
Rendering Enhancements
Feature Edges representation
Added a representation called Feature Edges to show the interesting edges of a data source, e.g., the cylindrical outline of a cylinder rather than the bounding box outline. Read more…
NaN color opacity
- The color for NaN (Not a Number) values has now an opacity property.
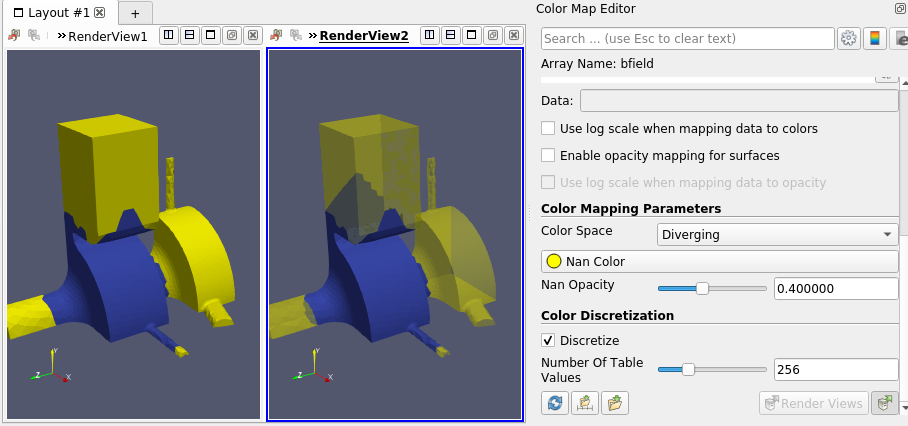 |
|---|
| Datasets with NaN values (in yellow). Opacity can be specified (right). |
OSPRay version update
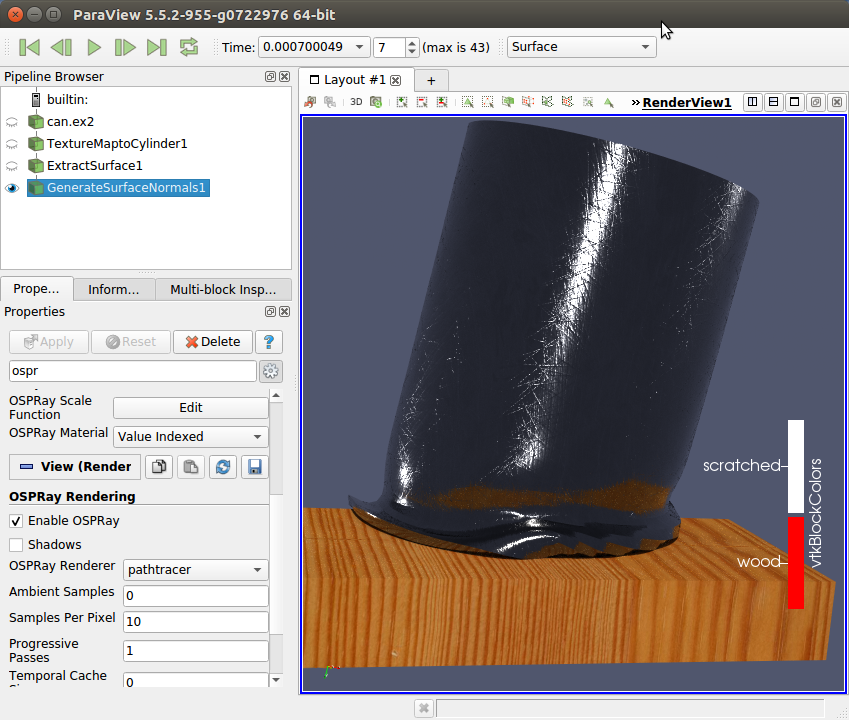
ParaView 5.6 updates its version of OSPRay to 1.6.1 and includes a number of OSPRay-related fixes and improvements. These include better memory management, more volume rendering controls and unstructured cell types, direct isosurface volume rendering, and new path tracer materials like the principled material as exemplified with the “scratched” sample material.
|
|---|
| OSPRay-rendered surfaces with new materials. |
NVIDIA IndeX plugin 2.2
Structured Volume Grids:
- New render engine provides optimized memory usage and faster initialization times.
- Added Catalyst support for In-Situ visualizations.
- Added support for all ParaView’s playback modes when using time series datasets.
- Added support for interactive changes of scalar values/properties.
- Added support to render volume combined geometry in cluster mode.
- Added support for datasets with signed types sint8 and sint16.
Unstructured Volume Grids:
- New Visual Elements presets: Iso-Surface, Depth Enhancement and Edge Enhancement.
- Added support for interactive changes of scalar values/properties.
Common:
- Added support for orthographic projection camera.
- Added support for logarithmic scale in colormaps when mapping data to colors.
- Improved profiling log: HW/SW information and detailed performance values.
Improve support of dependent components for volume representation
When volume representation is selected and Map Scalars and selected data array has 2 or 4 components, a new property called Multiple Components Mapping is available.
When this new feature is enabled:
- For a two-components array, the first component is mapped to the color, the second component is mapped to the opacity.
- For a four-components array, the first, second and third components are used as RGB values and the fourth component is mapped to the opacity.
Note that:
- This feature is only available when MapScalars is ON ;
- This feature forces Use Separate Color Map ;
- It scales the color and the opacity range with the correct component.
Slice representation lighting is turned off
Lighting on the Slice representation had the undesirable effect of darkening the slice with the default light, which is off center with respect to the view and focal points. We assume the common use case for this representation is to view the data as directly as possible to match colors on the slice with colors in the color legend. To better support this use case, lighting is disabled for this representation.
Min/Max lines in Quartile Chart View
It is now possible to show min and max lines in Quartile Chart View in addition to the average and median curves when plotting summaries for a dataset or extracted selection over time.
Add a Shader Replacements property to the Geometry representation
This new property allows customization of the OpenGL shaders used for rendering by providing some replacement strings for the shader produced by VTK. The replacements are prescribed through a JSON string like this:
[
  {
    "type": "fragment",
    "original": "//VTK::Light::Impl",
    "replacement": "gl_FragData[0]=vec4(1.0,0.0,0.0,1.0);\n"
  },
  // other replacements can follow
]
In the user interface, the property is represented with a custom widget that enables loading JSON from a file and saving its path as a preset. With this widget it is possible to select a preset replacements file, remove a preset from the list, and edit the content of the JSON string.
Miscellaneous bug fixes
macOS server configuration fetching fixed
Fixed a bug found in the 5.5 release wherein fetching server configurations would silently fail and another where mac clients built with OSPRay (like the official release binaries produced by Kitware) could not connect to servers built without OSPRay.
Color map range rescaling fix
Fixed an issue with the color map range getting automatically rescaled when it should not have been (this affected Catalyst as well).
Temporal Parallelism Script Generator
Updated the Temporal Parallelism Script Generator plugin to produce valid ParaView Python scripts.
Gradient filter
The gradient calculation for the 3D Lagrange cells has been fixed.
MPI4PY
A MPI4PY issue with SGI’s MPT MPI library has been resolved.
Pass Arrays filter
The Pass Arrays filter now properly deals with ghost information.
Point selection and hovering fixed in Slice view
A bug with point selection and the Hover Points selection mode has been fixed for the Slice view.
Hover Points and Hover Cells tooltip
The tooltip that appears when in Hover Points or Hover Cells selection mode is now placed correctly on the screen for systems with HiDPI displays.
Python 3.7.1 now supported
Some changes were made to support building with Python 3.7.1. Note that 3.7.0 is known to not work.
Developer Notes
Optionally use QWebEngine for help
The CMake option PARAVIEW_USE_QTWEBKIT, which did not work with Qt5 since WebKit was deprecated/removed, has been replaced with a new option PARAVIEW_USE_QTWEBENGINE which uses Qt’s WebEngine (the library that replaced WebKit).
Catalyst
New Catalyst Script Definition and Export
There is a new streamlined process for defining and exporting Catalyst scripts. The Catalyst Export Inspector panel is the new place to define everything you want Catalyst to eventually export. Your choices are saveable in ParaView state files and match the normal user interface for exporting data files and screenshots. There are some new options too, including choices to export Cinema Spec D tables and to place all Catalyst output inside a specific directory. To export the Catalyst Script you’ve defined, use the new Export Catalyst Script option.
Both entry points are under the Catalyst menu. The original Export State wizard and Data Extract Writers controls are still there, too, but they are deprecated and will be removed soon.
–live option
The ParaView client now has a –live=<port> option to automatically connect to a Catalyst-enabled simulation that is expecting a Live connection.
Simulating a Catalyst run
The example Python script Examples/Catalyst/SampleScripts/filedriver.py has been added. It can be used with pvbatch to emulate running a Catalyst-enabled simulation by reading in files and running Catalyst Python scripts. The script is documented on how to use it.
New output options
Generated Catalyst scripts now have the option to:
- start Catalyst output after a requested time step (while also forcing output at the very first time step to verify Catalyst output);
- output only requested arrays based on what arrays are read in when generating the Catalyst Python script;
- automatically handle the Catalyst adaptor channel names.