ParaView 5: Introducing the Point Gaussian representation

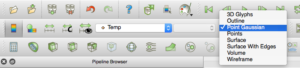
A new representation for rendering points, the PointGaussian representation, was recently added to ParaView. It extends the basic GeometryRepresentation as well as the UnstructuredGridRepresentation. To give the PointGaussian representation a try, simply choose “PointGaussian” instead of “Surface” as the representation for an applicable dataset.
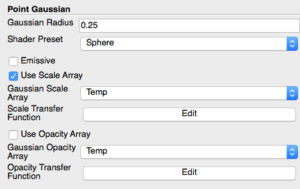
Once you choose the PointGaussian representation, look for the associated properties in the Properties Panel. You must have advanced properties toggled on in order to see them.
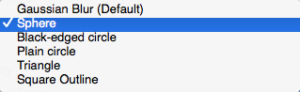
Until you choose a “Gaussian Radius” larger than zero, the new representation will simply render the data as GL_POINTS, which should be very fast but none of the advanced rendering properties will work. Setting the radius to something greater than zero will allow you to select one of the “Shader Preset” options or experiment with the other representation properties.
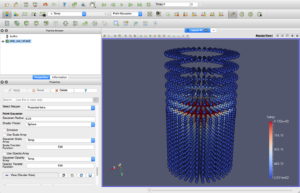
In the screenshot below, we use the new PointGaussian representation on the well-known “disk_out_ref.ex2” dataset, with a constant radius of 0.25 for the sprites along with the “Sphere” preset shader.
Some of the options available with the PointGaussian representation include setting point size and opacity using data arrays. When making use of these options, you can specify a piecewise function, which will map the data array values to opacities or sizes. The piecewise function editor also allows you to give the range of input values which will be mapped to the output range (currently fixed at [0, 1]). However, once you specify the piecewise function shape and input range, you can use the “Constant Radius” property to further scale the points uniformly. Doing so gives you a bit more control over the ultimate output range.
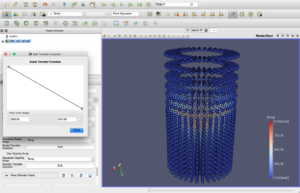
In the image below, we checked the “Use Scale Array” property. We then selected “Temp” as the scaling array and chose to edit the scale transfer function. We entered the full range of the temperature array in the edit boxes below the graphical function editor, and we opted to have the smallest temperatures map to the largest points, and vice-versa.
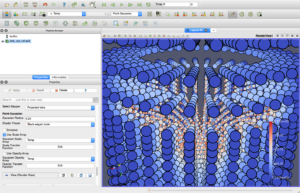
As shown below, we tried out the “Black-edged Circle” shader preset on the points.
So that’s it for now. Give this new representation a try, and feel free to use the mailing list to provide feedback or ask questions. Enjoy!
Scott,
It appears that the default range for Scale & Opacity transfer functions is [0-1]. Is there a way to use the data range instead? If not, doing it manually it a pain, do you plan to add a button to fill the piecewise ranges?
Best,
Joachim
Hi Joachim,
I did not find an obvious way to do this at the time. I will ask around and see if someone knows how it can be accomplished, but I’m not sure when I might be able to implement it. If you know of a way to handle this, I would love to learn about it! Thanks for your comment.
Cheers,
Scott
Hi,
What is the difference between the Point Gaussian and the Point Sprites representation?
I found it easier in Point Sprites to define the radius transfer function (in fact, I did not manage to display spheres with different radius in Point Gaussian).
And the Point Gaussian only works on scalar fields, whereas in Point Sprites, we can select the component.
Cheers,
Christophe
I concur with the previous comment. Is there an easy way to map the value of the radius of the sphere directly to an array? People often use paraview to post-process Discrete element simulations (granular flows of powder) and this feature is extensively used in that field…
Hello Scott,
This is Min.
I have so many questions…
What is the Gaussian radius?
What does it mean by “Use Scale Array”?
How to choose “Gaussian Scale Array” and “Scale Array Component”?
What is the difference between “Gaussian Scale Array” and “Coloring” array?
What is “Scale Transfer Function”?
For example, in my case, all the particles have the same radius which is 0.03cm, I just want to visualize ALL the particles with the REAL particle size, I am wondering how to set the above parameters.
If you could be so kind to have a look at this post, that would be great!
https://www.cfdem.com/forums/particle-sizes-are-not-consistent-between-glyph-filter-and-point-gaussian#comment-19426
Thanks and best regards,
Min
I have Paraview 5.4.1 64 bit but no “Point Guassian” in”Manage Plugins” or in the “Representation” field. How do I load “Point Guassian?”
How do I install “Point Gaussian” in Paraview 5.4.1 64 bit.
@HappyS5 back in v5.4.1, the Point Gaussian representation was only available on unstructured data (Unstructured Grid or PolyData), so you needed to convert your data to such a grid (eg. Threshold filter or whatever) to have it available. Since 5.5.2, it works with any kind of dataset, except in some specific cases. Support has been improved recently and should be better in 5.6.
@MIN ZHANG: In last master version (and in 5.6), we have added an option “Use Scale Transfer Function”, that allows (when turned off) to directly map the scale array to the glyphs size without using the transfer function that basically allows to map array values to a range between 0 and 1 using a user defined function.
Best,
Joachim