trame: Revolutionizing Visual Analytics with Python
In today’s data-driven world, the ability to effectively analyze and visualize complex information is crucial. Visual analytics combines analytical reasoning with interactive visual interfaces to facilitate the exploration, analysis, and understanding of complex data and systems. The ability to visually represent data interactively and intuitively allows end-users to discover patterns, trends, and insights that may otherwise go unnoticed. However, creating visual analytics tools that are versatile, user-friendly, and compatible across various computing platforms can be a daunting task.
The Challenges of Building Visual Analytics Tools
Creating effective visual analytics tools can be challenging, especially when considering modern applications’ diverse computing environments and requirements. Some of these challenges include:
- Supporting various computing platforms, including mobile, desktop, Jupyter, high-performance computing (HPC), and cloud.
- Ensuring compatibility with different operating systems, such as Linux, macOS/iOS, and Windows.
- Integrating with various programming languages, such as Python, C++, and JavaScript.
- Working with diverse graphics libraries, including OpenGL, Vulkan, Metal, ANARI, and WebGPU.
- Developing client-server applications that handle large data processing and computational loads.
- Creating portable user interfaces (UIs) across computing platforms.
- Developing web-based applications at a rapidly changing web pace.
Introducing trame: A Breakthrough in Visual Analytics
trame is a powerful and innovative solution that addresses the challenges of building visual analytics tools. Its open source Python framework enables developers to create visually stunning and interactive applications with scientific visualizations. trame simplifies the process of building web-based applications with its seamless integration of open source components, including VTK, ParaView, and Plotly. This allows developers to focus on the data analysis and visualization aspects without needing extensive web development knowledge.
- Cross-Platform Compatibility: trame supports various computing platforms, including mobile, desktop, Jupyter, HPC, and cloud.
- Integration with Open-Source Libraries: trame seamlessly weaves together powerful open source components, including VTK and ParaView, to provide a simple and easy-to-use platform for creating visual analytics applications with scientific visualizations.
- Easy-to-Use UI Creation: trame provides a simple and intuitive way to create UIs for visual analytics applications. By incorporating the Vuetify library, developers can easily design beautiful and interactive UI components, making their applications more user-friendly and visually appealing.
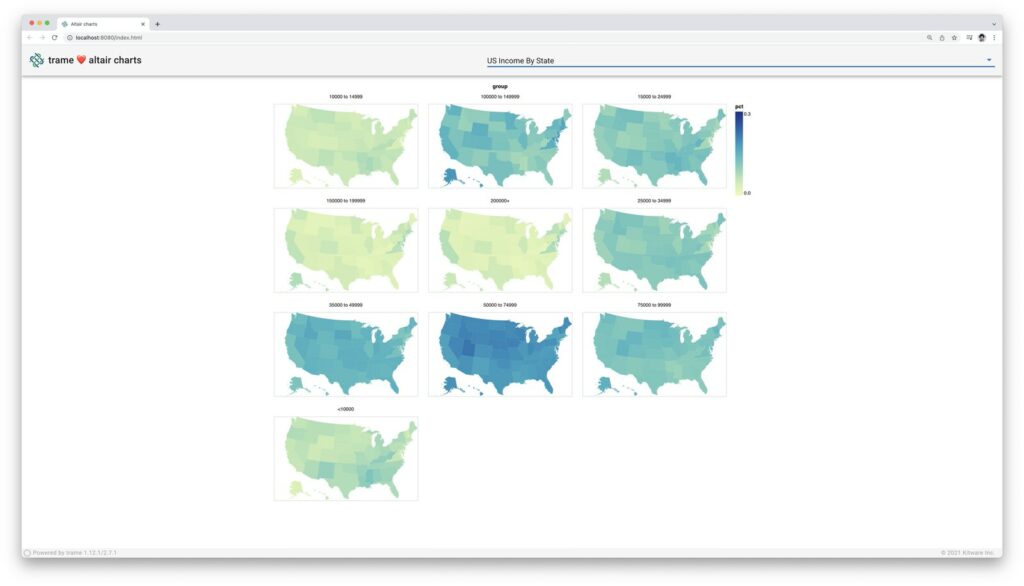
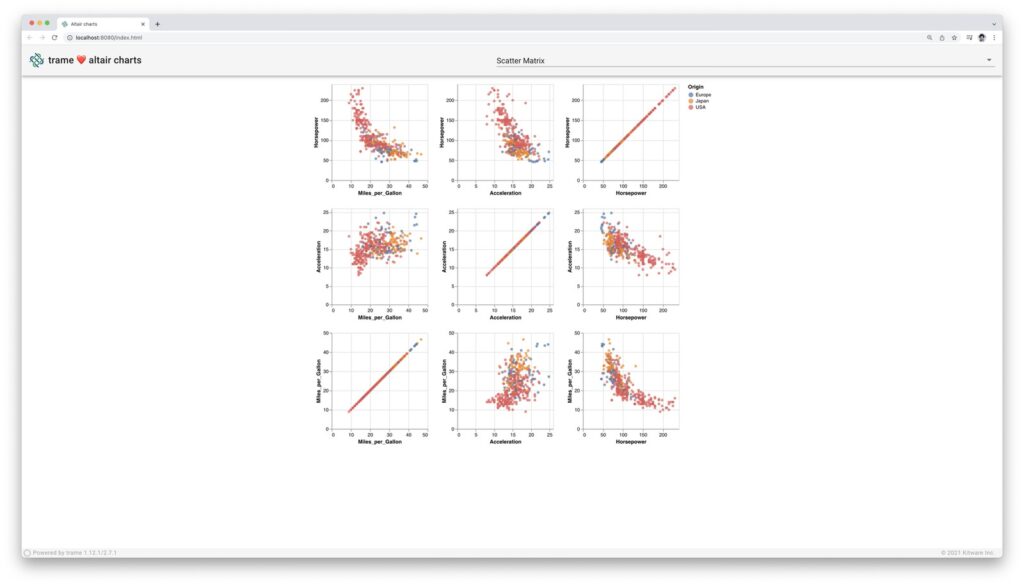
- Python Integration: trame is primarily built on Python, making it accessible to many developers. With trame, developers can leverage the integration capabilities to utilize existing platforms like Altair, Vega, Plotly, Matplotlib, PyVista, and Vuetify and incorporate new open platforms like FormKit, Grid-Layout, Monaco, and Xterm into visual analytics applications.
- Seamless Client-Server Communication: trame handles client-server coordination and state transfer transparently, enabling seamless communication between the front-end and back-end of the application. This capability allows for efficient processing and rendering, whether it’s performed on the client-side or server-side.
The Benefits of trame: Simple, Powerful, and Innovative
The name trame means “the core that ties things together” in French, which reflects the framework’s purpose of simplifying the development process. trame offers several key advantages that set it apart from other frameworks:
Simplicity
trame simplifies the development process by providing a clear and intuitive API for building applications. With trame, developers can focus on the data, analysis, and visualization without the complexities of web development. The framework enables developers to build powerful applications without extensive knowledge of web technologies quickly.
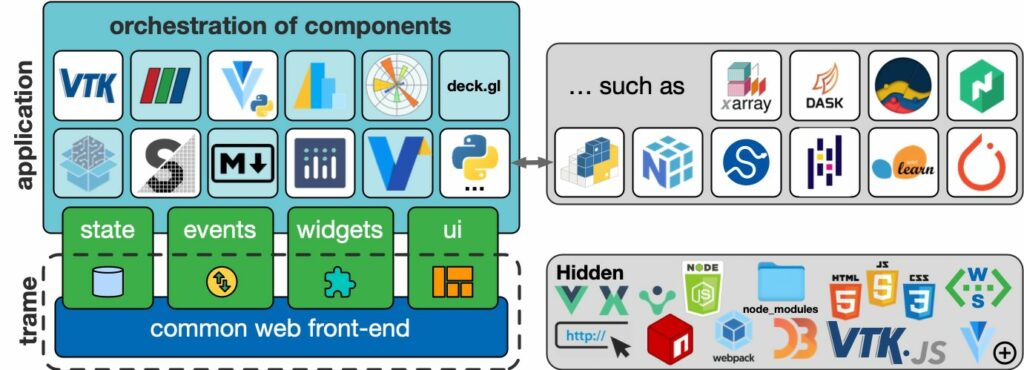
Building a trame application is just a matter of orchestrating the various components of the application leveraging the Python API for interacting with state, events, widgets, and UI conveniently and transparently.
Power and Flexibility
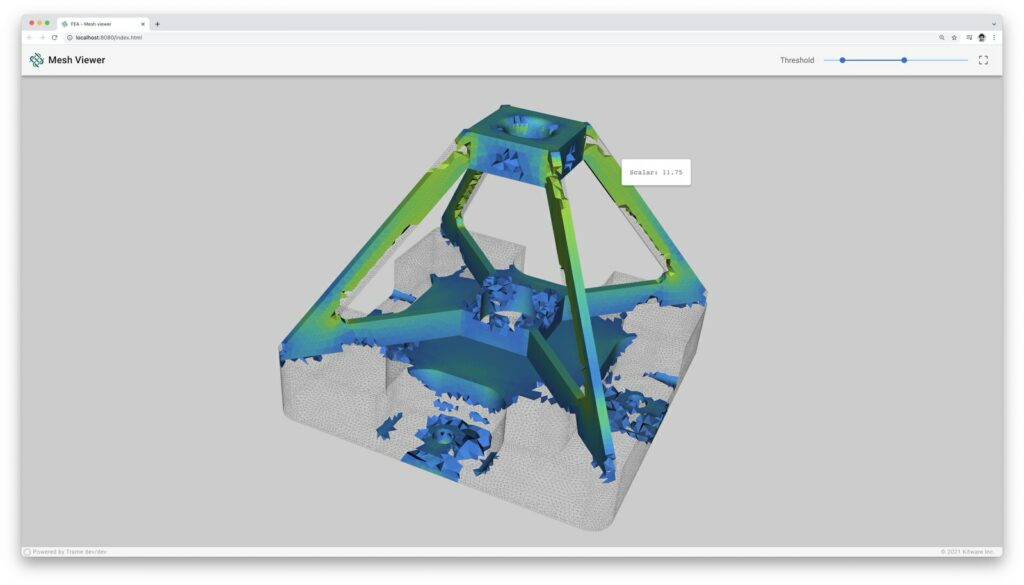
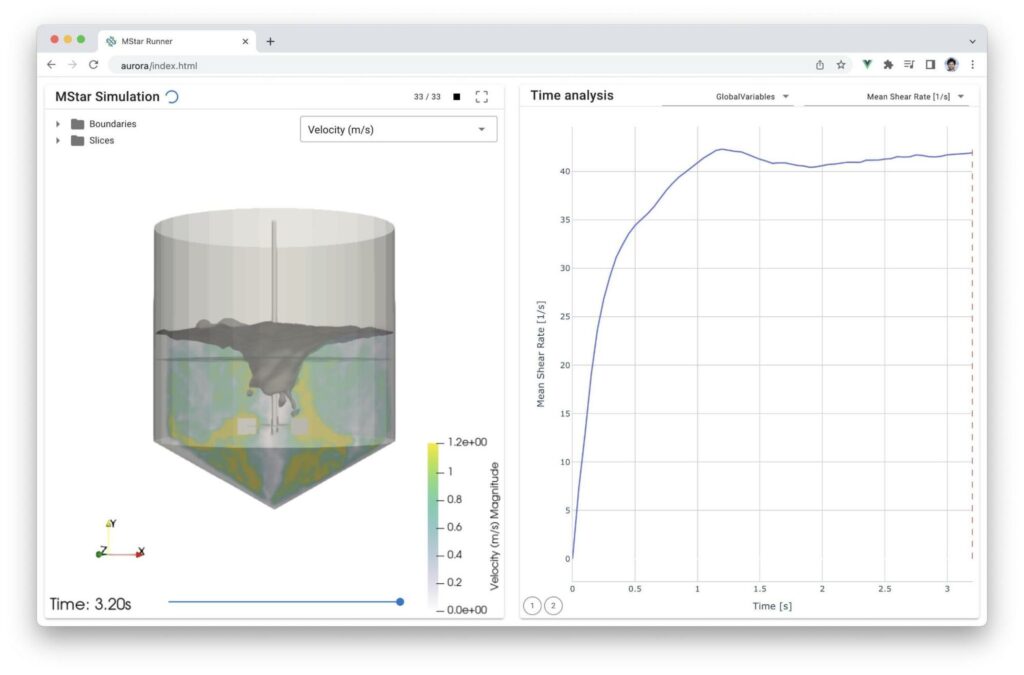
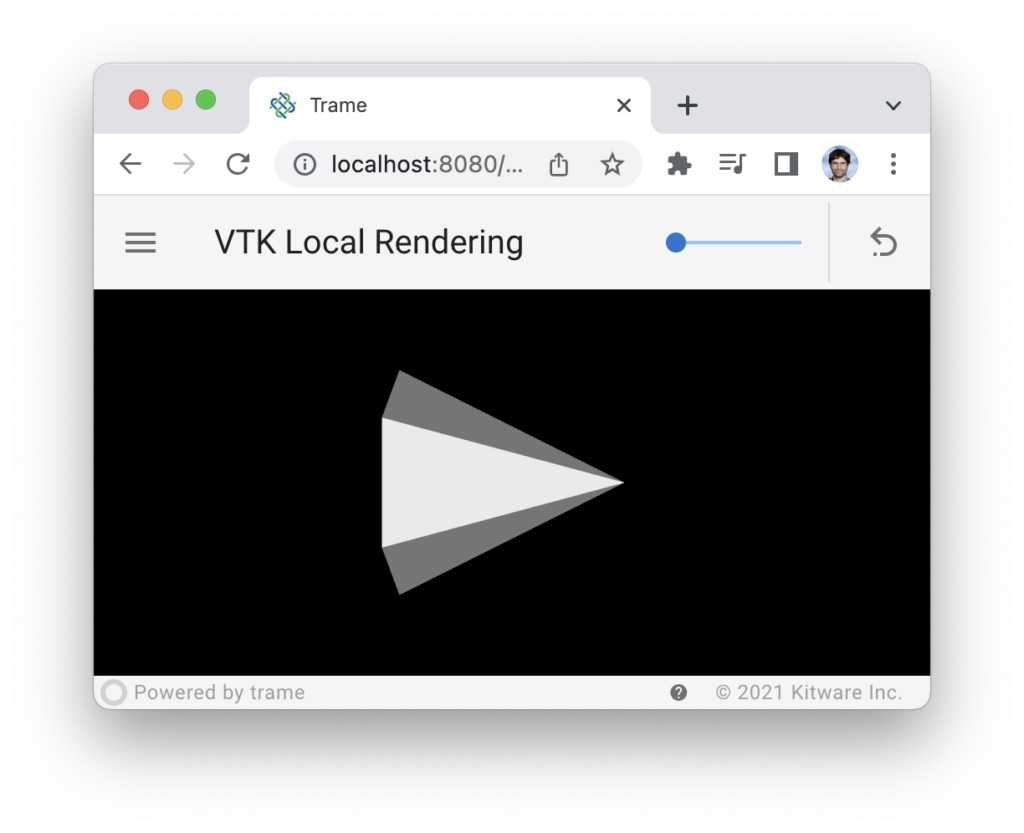
Various tools and frameworks are available to build visual analytics applications, but only trame can provide full-featured interactive 3D visualization. trame harnesses the power of industry-leading, best-in-class platforms like VTK and ParaView to provide complete control over the processing for analysis and 3D visualization. Developers can leverage the extensive capabilities of these platforms while benefiting from trame’s simplified integration. And the flexibility of either local rendering or remote rendering is seamlessly exposed in trame through a single method call.
Rich Features and Integration
trame leverages existing state-of-the-art libraries and tools. This integration enables developers to utilize the full capabilities of these libraries and tools within their trame applications to create compelling user interfaces and interactive visualizations without reinventing the wheel. trame’s integration capabilities extend beyond the built-in libraries and tools, enabling seamless integration with other popular systems like PyVista and PyTorch.
Portability and Deployment
trame applications can be deployed on local desktops to remote clouds. This flexibility allows end-users to access web-based trame client-server across different computing environments. Wherever the application runs, trame provides a seamless, consistent experience.
Open Source
trame is open source and licensed under the Apache License Version 2.0, allowing developers to create their own open source or commercial applications without licensing restrictions. Whether you’re building applications for research, commercial use, or personal projects, trame offers a flexible and reliable platform to bring your visual analytics ideas to life.
Getting Started with trame
You can start building interactive visual analytics applications with trame by following these simple steps.
Get hands-on guidance from one of the trame developers at Kitware! Register for our upcoming “Intro to trame” training course.
1. Install trame – Begin by installing trame using pip, a package manager for Python:
pip install trame trame-vuetify trame-vtk2. Define application logic – Next, create the processing functions in plain Python and define the state shared with the UI. This task includes defining the data analysis algorithms and any parameters the end-user can adjust.
3. Reactive to state changes – Define methods that respond to changes in the shared state. For example, if a slider is used to adjust a sampling parameter, define a method that updates the sampling algorithm based on the new slider value.
4. Design the UI – Build a beautiful and accessible UI by defining the layout of your application and connecting the state and functions to the UI elements directly. trame provides a built-in Material Design widget library accessible through Vuetify (https://vuetifyjs.com/en/components/all/), making creating visually appealing UI components easy.
5. Run the Application – Once the application is ready, it can be run locally as a desktop (still a client-server) application.
python app.py --port 1234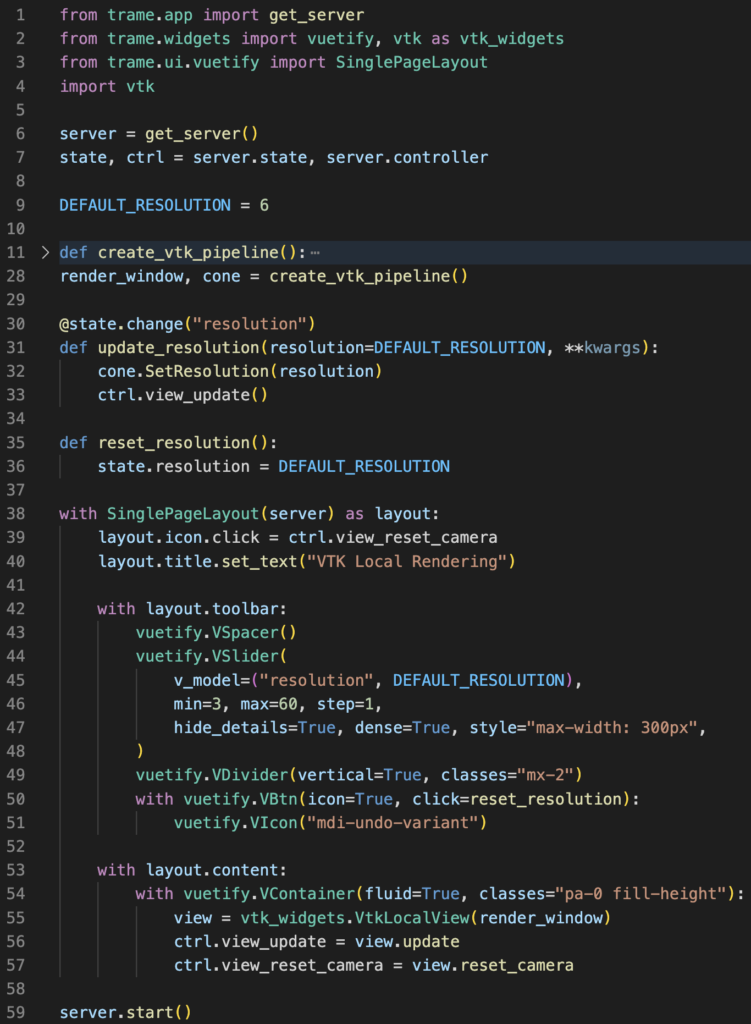
Make Your Data Come to Life with trame
trame is a game-changer in the field of visual analytics. With its focus on analysis and visualization, trame removes the complexities of web development and enables developers to focus on what matters most: unlocking insights in their data. Start exploring trame and see how it can revolutionize your data analysis workflows. For more information, including tutorials, the discourse forum, and other helpful resources, visit the trame website.