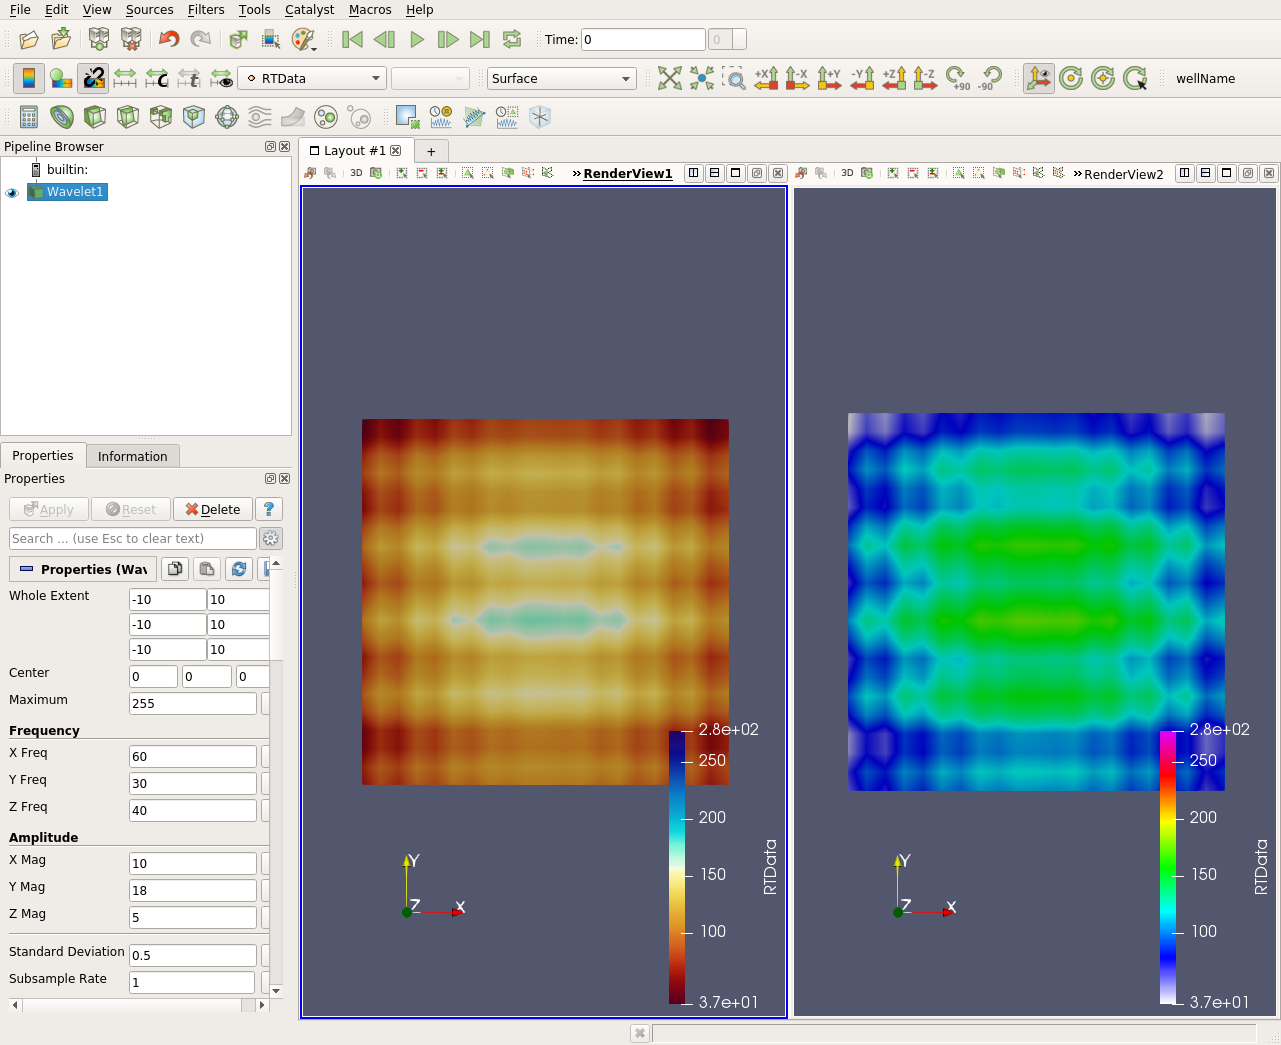
Separate Color Map Feature

One of the great features of ParaView is the ability to easily compare dataset which are not actually connected to one another. It is achieved by sharing Color Map (aka the color mapping between the value on the data and the color displayed on screen) between representations by array name.
But even if it is widely used, there are some cases where, one would not want to share and actually have an arbitrary Color Map by representation: where changing a Color Map in one place will not influence the visualization of another dataset (or the same) in another view.
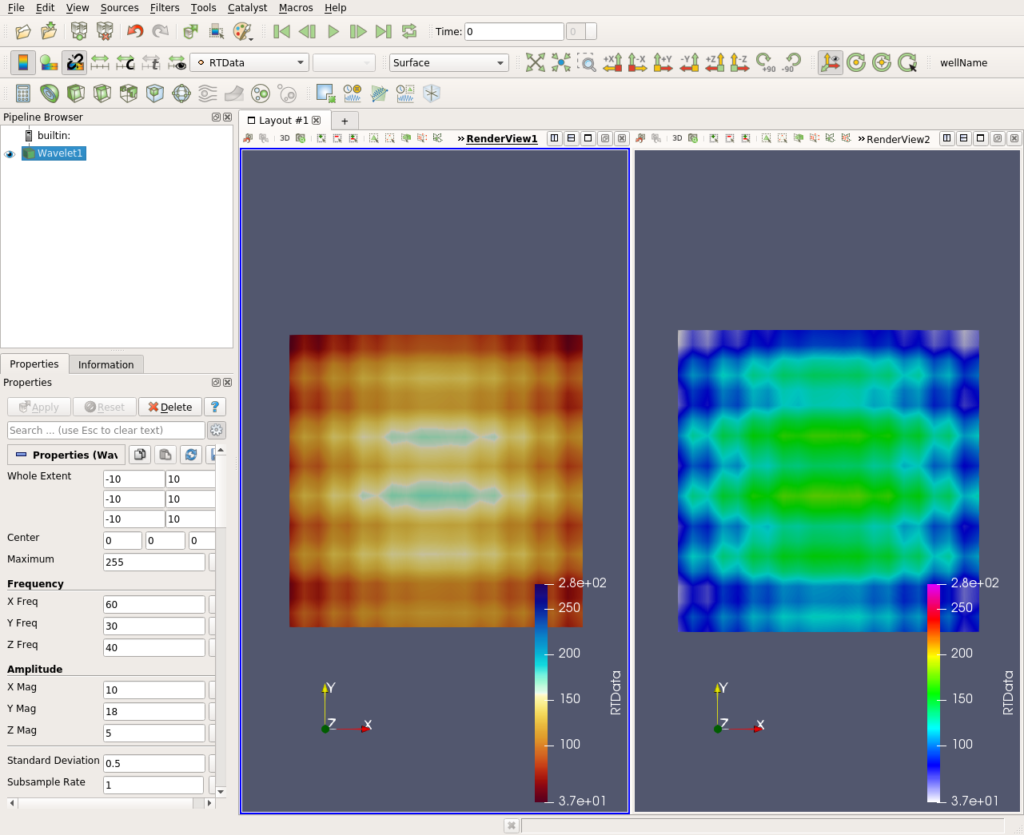
This is now possible thanks to the new button “Use Separate Color Map” in the Color Toolbar :
Please give it a try and let us know what you think of it.

Acknowledgments
This work has been founded by EDF SA, in the context of the MOVIDO/ParaVis/SALOME project.
Great! Could something similar be implemented to time-series ?
Do you mean, to have separate color table for each timestep ? I’m afraid that is not planned.