TensorBoardPlugin3D: Visualizing 3D Deep Learning Models in TensorBoard
We are excited to announce the development of TensorBoardPlugin3D. This open source, intuitive plugin for TensorBoard allows medical image deep learning researchers to analyze their deep learning workflows and 3D data all in one tool.
TensorBoard is one of the leading tools used by computer vision researchers to analyze the performance of their deep learning systems. Their data is typically 2D, including photographs, videos, and satellite imagery. One of TensorBoard’s most powerful features is that it allows computer vision researchers to quickly cycle through hundreds of 2D image results, e.g., displaying ideal 2D image segmentations with network segmentations overlaid so errors and systematic biases can be quickly discovered.
However, in deep learning research for medical imaging, the image data is typically 3D, which is not supported by TensorBoard. As a result, TensorBoard has not been widely adopted by the medical image AI community, and its capacity for providing network training insights has been lost. This forces researchers to review their 3D data as sequences of 2D slices. Such slice-by-slice review is time-consuming and requires significant effort. Researchers have to create a 3D mental model of each set of inputs and outputs, otherwise the existence and nature of errors spanning multiple slices are missed and associated insights go undiscovered.
TensorBoardPlugin3D integrates 3D visualizations into the TensorBoard workflow, allowing the full power of TensorBoard to be applied to medical image deep learning research.
Background
In recent years, deep learning has shown great success in medical image analysis. Developments in neural networks for classification, detection, registration, and segmentation of medical images are advancing clinical practices and improving the consistency and accuracy with which images can be read. This has produced a rapidly growing area of interest in both academia and clinical settings that calls for generalized algorithms, reproducible results, and a simple and complete set of tools for analysis of the produced results.
To achieve the required reproducibility, scalability, and simple deployment that users require, deep learning frameworks are adopted. Some of the most popular and commonly used include TensorFlow, an open source framework developed by Google, and PyTorch, a pythonic framework developed by Facebook. Both offer a variety of fast and useful features to suit an array of needs. Both workflows also analyze the training and the final model output. But this is where TensorFlow’s visualization tool, TensorBoard, really shines. With options for visualizing scalars, graphs, distributions, histograms, and images, TensorBoard provides much more than PyTorch’s alternative Visdom and is typically the preferred option no matter the framework the user has chosen.
While TensorBoard offers a great selection of tools to meet the visualization requirements of a complete workflow, it falls short in providing a way to view 3D data, thus creating a significant gap in the needs of the medical deep learning community and limiting the appeal of the tool in this field. Kitware is striving to eliminate this disparity by providing a new plugin for TensorBoard that supports 3D visualization, effectively rounding out the features that are provided for deep learning analysis.
Typical workflow
To get a sense of how this problem plays out in a typical workflow we can take a look at an example from the tutorials offered by MONAI. MONAI is an open source, deep learning framework based on PyTorch that specializes in medical imaging. MONAI also provides a large selection of tutorial notebooks that go step by step through different training processes based on your goals (e.g. segmentation, registration, classification) and the various data types.
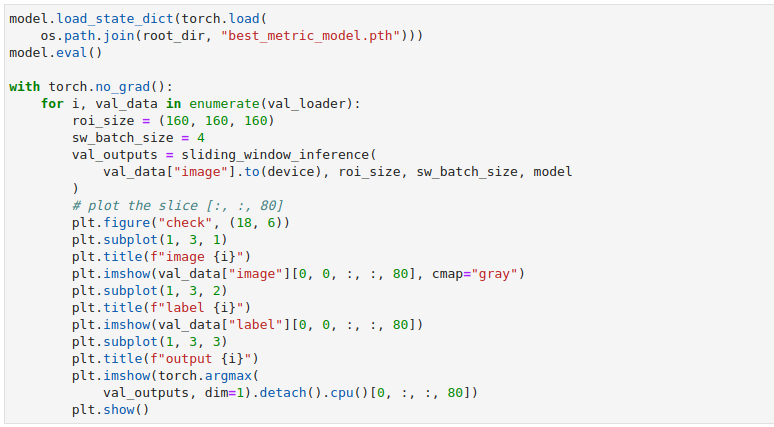
Looking at MONAI’s spleen 3D segmentation example we see that the training data is downloaded and then transforms are applied. The model, loss, and optimizer are created and a typical PyTorch training process is executed. From there the average loss and mean dice plots are created, and then further down the slices of the model output are plotted alongside the input image and label to try and check for the best results.
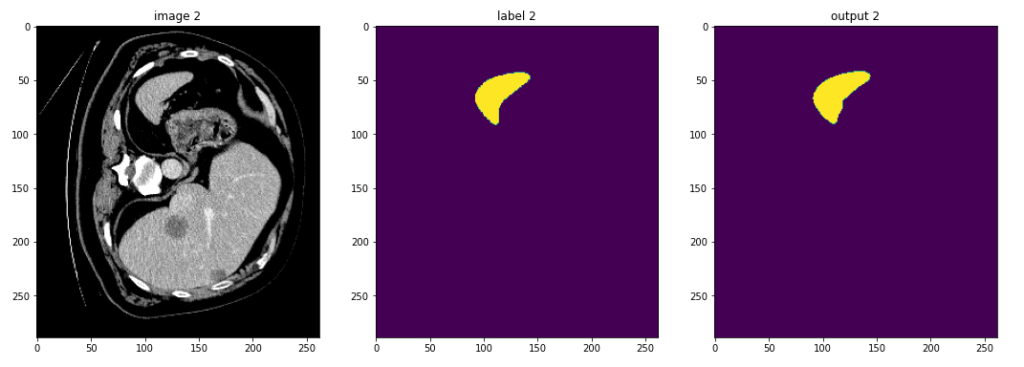
This approach is scattered over multiple cells, and results in unnecessary repetition and replotting to ensure that you are viewing useful data and can confidently trust the results. An ideal scenario would allow all of this data to be viewed together instead.The TensorBoardPlugin3D finally makes that a viable option.
TensorBoardPlugin3D
TensorBoardPlugin3D was built using the ITK/VTK Viewer, which leverages VTK.js and ITK-wasm to process and visualize volume data. Although the ITK/VTK Viewer already provides components for building applications, a new library of components was built using React and MaterialUI to match the existing MaterialUI design of TensorBoard. The design approach of the component library remains the same, however. This makes the user interface customization simple since you can add as many components to the UI as needed, in addition to custom components. Thanks to this feature, we were able to add all of the same components and options that are currently available in ITKWidgets and added an additional component to support toggling through the available model output. So, as features continue to be added to VTK.js, ITK-wasm, and the ITK/VTK Viewer, they will be added to TensorBoard as well.
Getting Started
Very few changes are required to provide TensorBoard with the information that it needs to begin visualizing data in the plugin. First, simply pip install the plugin:

Now, instead of plotting one 2D slice with matplotlib we can take advantage of MONAI’s plot_2d_or_3d_image function and pass it our full 3D data.
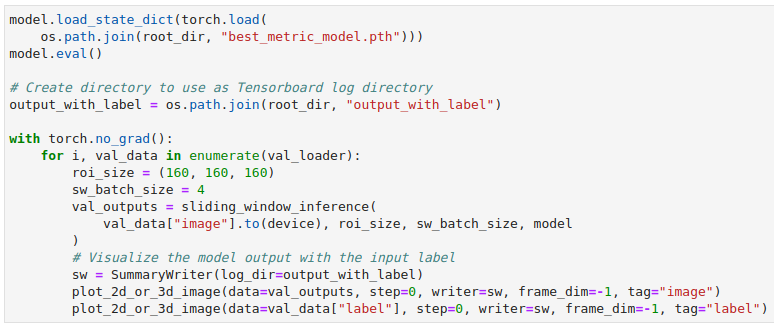
In this example, we are writing out the model output as the image and the input label as the label. This will allow us to observe the output volume on its own if we choose, or to show that volume with the ideal output overlaid so that we can check for flaws and inconsistencies. The call to plot_2d_or_3d_image will create the appropriate events file that TensorBoard needs. The directory that the data has been written to can be pointed to with the –logdir flag and then when TensorBoard has been invoked in the notebook or from the command line at least two tabs will appear along the very top: Images and TensorBoard 3D.


Viewing Results
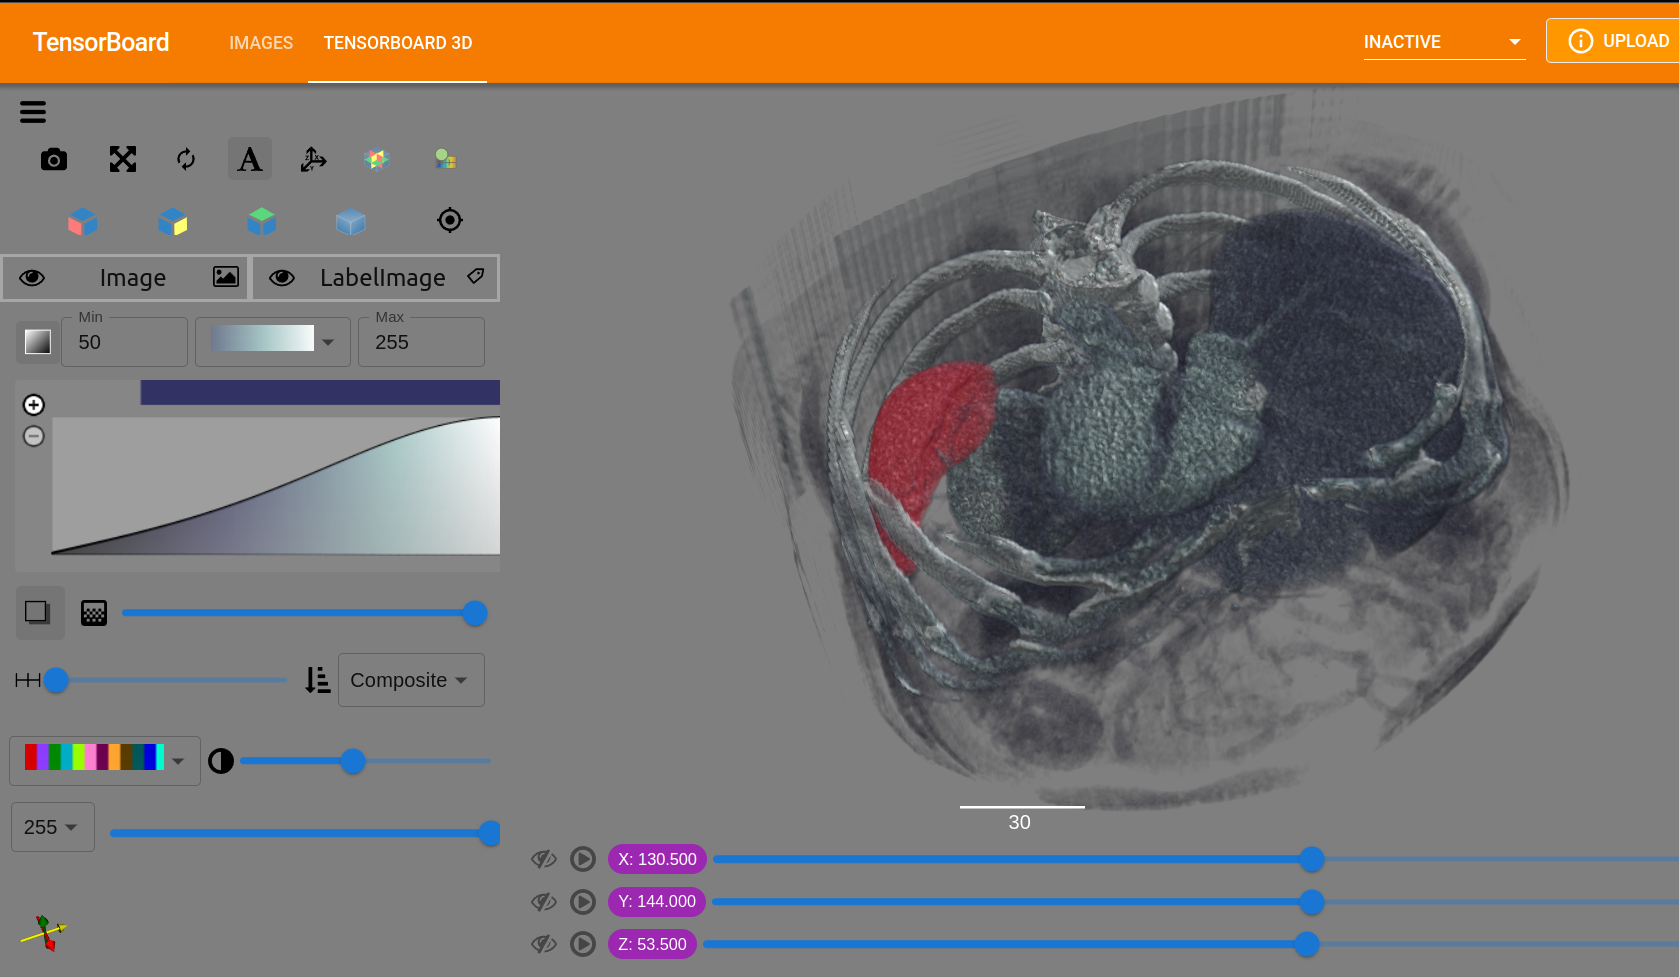
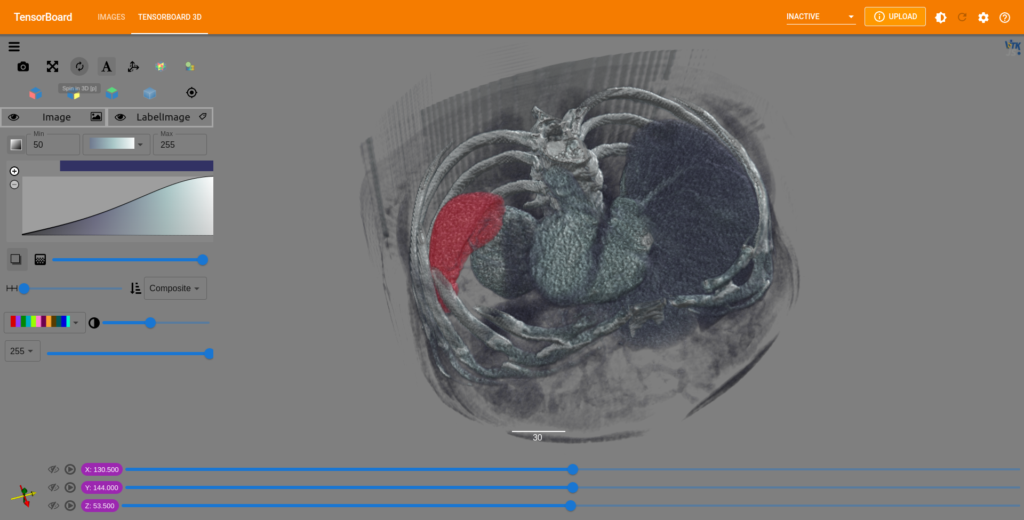
Selecting the TensorBoard 3D tab will load the first volume and its associated label (if there is one), along with tools for adjusting the image color map, sample distance, color range, label image blend, and more.
Once all of the values have been set and the image appears as expected, you can toggle through any of the remaining output models and all of the settings will be applied to each subsequent volume. In 3D, it is simple to view disparities between the input and output data. By cycling through all of the generated results using such visualizations, new insights into training successes, errors, and biases can be gained.
Try It Yourself
Perhaps best of all, the TensorBoardPlugin3D is available wherever TensorBoard is available. This means that with a simple pip install, users can access the plugin from the command line or in notebooks like JupyterLab, Colab, and SageMaker.
If you’re looking for a quick start to experiment with viewing and manipulating real data, begin with our example notebooks that use cached data from previous training runs. You can also explore an entire training and analysis workflow using the full tutorial notebooks.
View the cached spleen segmentation notebooks illustrated in this blog in Binder or Colab.
Conclusion
TensorBoardPlugin3D offers a simplified solution to a previously incomplete and, consequently, unnecessarily complicated workflow. Users are now able to view the entirety of their three dimensional deep learning model output at once as well as compare it to the original input. With this in addition to the existing options to plot metrics like average loss and mean dice in TensorBoard, medical researchers and the deep learning community finally have the complete and robust analytical tool that they have long needed. analyzing an entire training process is now as simple as toggling tabs. You can see the difference for yourself with our quick start guide, or check out the full documentation for a complete overview of the TensorBoardPlugin3D features and guide to getting started with our notebooks.
This work was funded, in part, by NIH grants R01EB014955, R42NS086295, R01EB028283, and R01EB021396.