Unlocking Geospatial Insights: Integrating 3D Tiles and GeoTransforms into ParaView for Seamless Geospatial Data Processing
The widespread adoption of 3D Tiles as an open data format for streaming geospatial data, including buildings, point clouds, and meshes, to web browsers signifies a notable trend in the GIS domain. In our previous work, we demonstrated the application of VTK and Python to address the intricate task of converting polygonal data sourced from formats like OBJ or CityGML to the 3D Tiles format.
While successfully visualizing 3D Tiles using Cesium.js in a web browser, a significant technical challenge arose: integrating this data seamlessly into VTK or ParaView for subsequent processing and simultaneous display with other datasets. To overcome this challenge, we introduce two key components — the vtkCesium3DTilesReader and enhancements to vtkGeoTransform. These additions are specifically engineered to optimize and simplify the integration process within the VTK and ParaView frameworks.
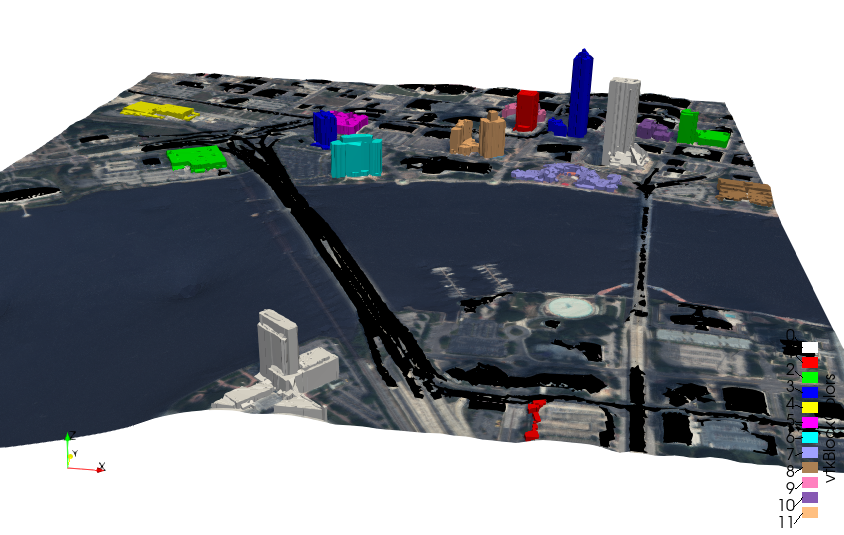
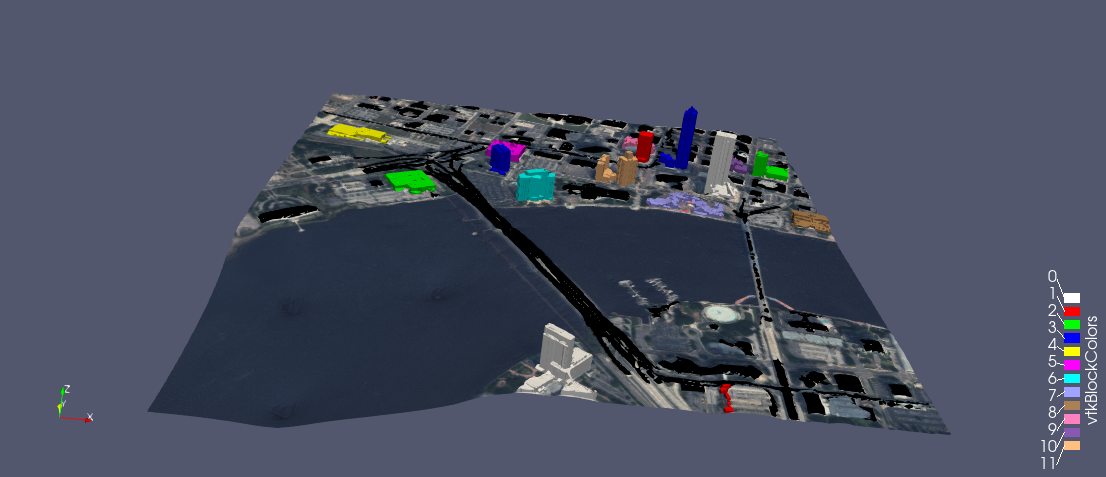
In Figure 1, we exemplify the utilization of the recently introduced reader and the enhanced GeoTransform in ParaView. To recreate this visualization, proceed by loading the datasets delineated in Figure 1 through the following steps:
- Download the provided zip file containing the ParaView State File and required data files, accessible here.
- Once decompressed, launch ParaView (nightly version 5.12.20231214 or later or release 5.13 or later) and load the State File via the ‘File / Load State’ menu, opting to ‘Search files under specified directory.’
- This process initializes the pipeline illustrated in Figure 2, ultimately resulting in the rendering of the image featured in Figure 1.
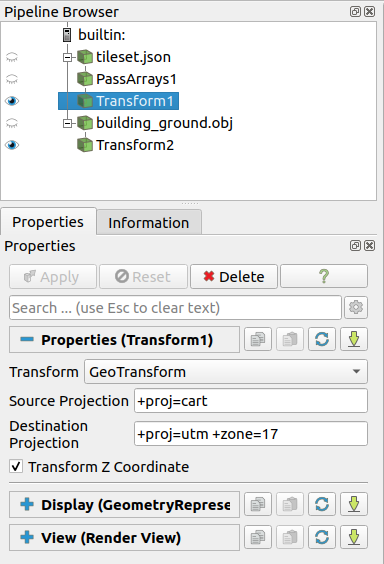
The pipeline seamlessly integrates diverse geospatial datasets, commencing with the utilization of the 3D Tiles Reader (tileset.json) to process building data. Subsequently, a PassArray filter intervenes to eliminate the NORMAL array. This is a preemptive measure, considering that the computation of transform function derivatives for the GeoTransform is part of future work. The Transform filter, equipped with a GeoTransform, proficiently converts Cartesian points from the Source Projection to UTM, serving as the Destination Projection.
Concurrently, the OBJ Reader (buildings_ground.obj) is engaged to manage ground features. A second Transform filter, specializing in translation, precisely adjusts the mesh in UTM space. This meticulous process ensures an exact alignment with the transformed 3D Tiles data.
Acknowledgements
Portions of this work were funded by the US Department of Energy’s Office of Biological and Environmental Research (BER) to develop Pan3D, an open source toolkit supporting scalable and reproducible scientific workflows for 3D data analytics.