Getting Started with MAP-Tk for Aerial Photogrammetry
![]() A recent “Kitware Source” article [1] introduced the Kitware Image and Video Exploitation and Retrieval (KWIVER) tookit. KWIVER is a collection of open-source computer vision software tools for video analytics. This article goes into depth on one of the components of KWIVER: Motion-imagery Aerial Photogrammetry Toolkit (MAP-Tk) [2].
A recent “Kitware Source” article [1] introduced the Kitware Image and Video Exploitation and Retrieval (KWIVER) tookit. KWIVER is a collection of open-source computer vision software tools for video analytics. This article goes into depth on one of the components of KWIVER: Motion-imagery Aerial Photogrammetry Toolkit (MAP-Tk) [2].
MAP-Tk provides tools that estimate camera parameters and three-dimensional (3D) measurements in video. Specifically, the tools estimate camera poses (e.g., position and orientation), camera intrinsic parameters (e.g., focal length and radial distortion), and sparse 3D point clouds of landmarks in scenes. Computer vision literature refers to such estimation as structure from motion (SfM). In addition to SfM, MAP-Tk offers image stabilization for use in other parts of KWIVER such as the moving object tracker.
MAP-Tk has similar goals to other open-source SfM software such as Bundler [3], VisualSfM [4], and OpenMVG [5]. While most other systems concentrate on unordered collections of photographs, MAP-Tk exploits temporal order and continuity in video. In particular, MAP-Tk focuses on aerial video and its unique challenges and opportunities.
MAP-Tk provides a C++ application programming interface (API), command-line interface (CLI) tools, and a graphical user interface (GUI) application. Kitware offers all of these components under a permissive Berkeley Software Distribution (BSD) license with commercial support.
The framework of MAP-Tk is highly modular. It uses plug-ins and configuration files to combine and configure different algorithmic components at runtime. The core of MAP-Tk has minimal dependencies, but the plug-ins bring in established algorithms from other open-source toolkits like Ceres Solver [6], OpenCV [7], and VXL [8]. The MAP-Tk development team recently factored out the core framework and moved it into Vital [9], a new repository, for better reuse across KWIVER tools. For more details on the architecture and algorithms of MAP-Tk, please see the paper “Open Source Structure-from-Motion for Aerial Video” [10].
The remainder of this article steps through some examples to demonstrate how to start using MAP-Tk. The software, sample data, and configuration files are all available for download.
MAP-Tk Installation
The MAP-Tk source code is available on GitHub [2]. One option to build the source code on Windows, Mac OS X, or Linux is to use CMake. The easiest way to try out the software, however, is to grab one of the binary packages for the latest release. Examples in this article use the MAP-Tk 0.8.0 release. Binary packages of this release are available at https://github.com/Kitware/maptk/releases/tag/v0.8.0.
The binary packages prominently feature the GUI application MapGUI and include CLI tools. In the current release, the GUI can visualize results from the CLI tools. For now, the GUI only runs a subset of the computational pipeline; the CLI tools do the rest. The binary package for a Windows installation stores the CLI tools in C:\Program Files\MAP-Tk 0.8.0\bin. The binary package for a Mac OS X installation stores the tools in /Applications/MAP-Tk.app/Contents/bin, and the binary package for a Linux installation stores the tools in /usr/local/bin (assuming default install paths).
The following examples work through an end-to-end pipeline using two of the tools: maptk_track_features and maptk_bundle_adjust_tracks.
Note: MAP-Tk loads plug-ins and configurations files dynamically at run time. Relative to the above bin paths, it installs these files in ../lib/maptk and ../share/maptk/0.8.0/config, respectively. In a standard install, MAP-Tk finds these files automatically. Environment variables KWIVER_PLUGIN_PATH and KWIVER_CONFIG_PATH will extend the search paths, if needed.
Test Data
The KWIVER website contains downloadable data for following along with the examples discussed in this article on http://www.kwiver.org/TestData. This article covers two data sets. The first, kwiver_fmv_set_1, is the same full-motion video (FMV) sample from the “Kitware Source” article on KWIVER [1]. The second, kwiver_wami_set_1, is a down-sampled excerpt of the Columbus Large Image Format (CLIF) 2007 data set from Air Force Research Laboratory (AFRL) [11].
The examples directory in MAP-Tk contains the configuration files that correspond to both data sets. These data sets provide videos as sequences of image files (Joint Photographic Experts Group (JPEG) or Portable Network Graphics (PNG)). MAP-Tk currently requires image sequences, but future releases will handle video files directly. One way to obtain a sequence of images from a video file is to use FFmpeg [12].
Feature Tracking
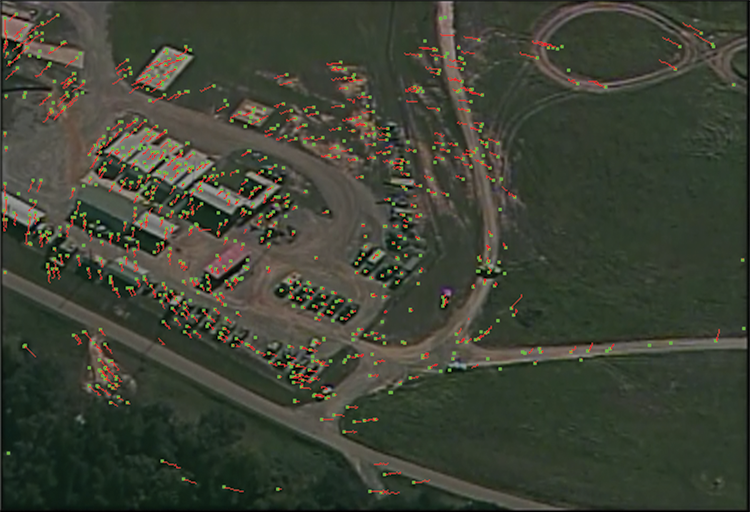
The first step in the SfM pipeline is to track image features. A feature is the two-dimensional (2D) image coordinates of a distinguishable scene location that appears repeatedly across images. A feature track is the association of a feature across multiple images. Each feature track has the potential to become a 3D landmark during bundle adjustment, which is the second step in the pipeline.
Running maptk_track_features with a configuration file such as the following computes the feature tracks:
maptk_track_features -c my_track.conf
The configuration file specifies the input and output files, the selection of algorithms from the plug-ins, and the parameters to the algorithms. The main configuration file can include other configuration files. This allows for the utilization of reusable files that contain the default configuration for each algorithm. In this case, the configuration files for feature tracking are the same for both data sets. They use Speeded Up Robust Features (SURF) detection and matching from the OpenCV plug-in with homography-guided feature matching and loop closure from Kitware [10].
While the default parameters work reasonably well out of the box, other data sets may need some parameter tuning. One commonly tuned parameter is feature detection sensitivity, which controls the number of features a detector tracks. For the OpenCV SURF detector, this parameter is detector:Feature2D.SURF:hessianThreshold.
The value 1000 suffices for these examples, but it may be too high or low for other imagery with different resolutions or contrasts. In general, adjusting the threshold to produce around 500 to 1000 features works well.
The key input/output parameters for the maptk_track_features tool are image_list_file and output_track_file. The former points to a text file that lists paths to all images that the feature tracker will process. The latter points to a text file that will contain the computed tracks. Optionally, specifying output_homography_file provides a homography sequence for use in video stabilization applications. Figure 1 displays the outcome of feature tracking on
kwiver_fmv_set_1.
Bundle Adjustment
The second step in the SfM pipeline is bundle adjustment. This step optimizes both camera and 3D landmark parameters. The CLI tool maptk_bundle_adjust_tracks takes the feature track output from the previous step and estimates the cameras and 3D landmarks. This tool can optionally take in metadata as additional input (e.g., from the Global Positioning System and Inertial Measurement Unit systems). MAP-Tk currently supports reading and writing metadata in the POS format that the CLIF data [11] provides. Future releases will handle other metadata formats.
Running the maptk_bundle_adjust_tracks tool follows the same pattern:
maptk_bundle_adjust_tracks -c my_bundle_adjust.conf
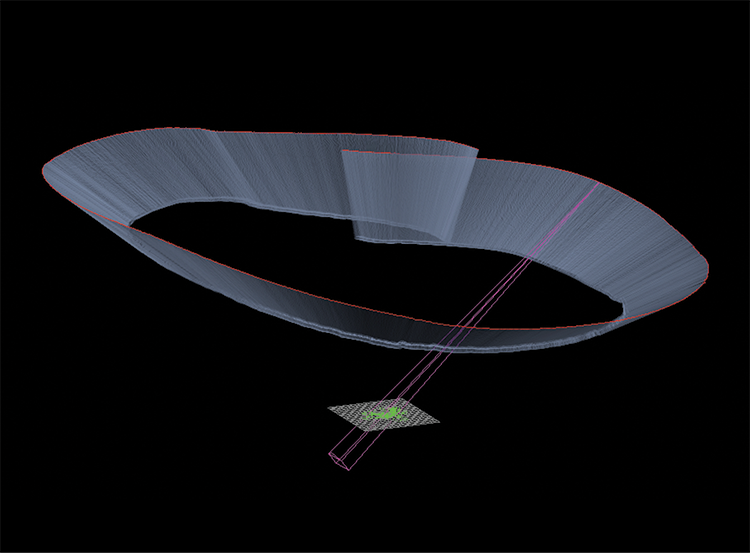
This time, however, the configuration is a little different between the two data sets. For example, some of the configuration options provide base camera parameters, which are the initial values for the intrinsic parameters for the camera (e.g., focal length, principal point, etc.). These parameters differ between the data sets. Furthermore, the CLIF example uses metadata for initialization, whereas the FMV example configuration does not use any metadata. Instead, the FMV example bootstraps the camera locations from the imagery incrementally using essential matrix estimation from the VXL plug-in [8]. The FMV data also has a higher frame rate and is more redundant than the CLIF 2007 data. Therefore, the configuration file for this data enables a hierarchical bundle adjustment approach [10].
Configuration files for both sample data sets use the Ceres Solver [6] plug-in to perform the bundle adjustment itself. There are numerous parameters to the Ceres Solver to adjust. Based on the configuration in the examples, the Ceres Solver plug-in estimates a shared focal length across all the frames, ignores radial distortion, uses a Cauchy robust loss function, and utilizes an iterative Schur linear solver with Schur-Jacobi preconditioning. Numerous configurable parameters determine termination conditions and control which solver to use and which parameters to estimate. Figure 2 presents the output of the bundle adjustment for kwiver_fmv_set_1.
Visualization
MapGUI provides a graphical tool for visualizing the outputs of MAP-Tk. Qt serves as the foundation for MapGUI, and the Visualization Toolkit (VTK) furnishes the visualization. As shown in Figure 3, MapGUI has a main World View with dockable Camera View and Camera Selection panes.
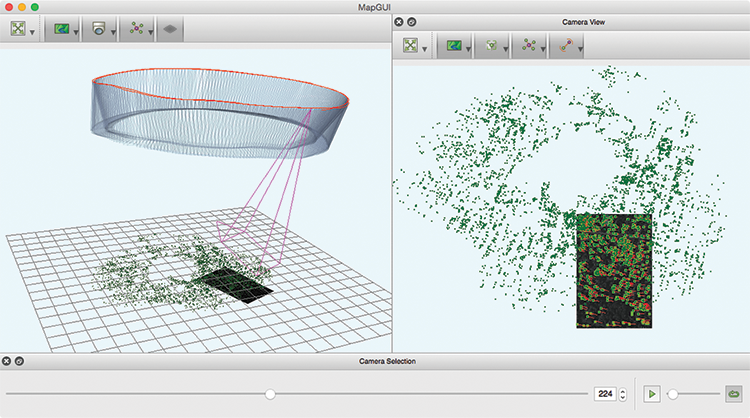
The World View displays the cameras, landmarks, and ground plane in a 3D viewer. It highlights one active camera and projects the corresponding video frame onto the ground plane. The Camera View shows the same active video frame in a 2D viewer. The viewer displays the features, tracks, projected 3D landmarks, and bundle adjustment residuals on top of the video frame. The tools at the top of each view can resize, re-color, or hide rendered components.
The Camera Selection pane selects the active frame with a slider that scrubs through the frames. It also allows for playback of a video at various speeds.
The easiest way to view MAP-Tk results in the GUI is to use File->Open in the menu, and select the same configuration file that the CLI tools received. The MapGUI application will load the input and output files that the configuration file specifies. The maptk_bundle_adjust_tracks configuration file refers to all the data that the GUI can display. Another option is to open a configuration file for maptk_track_features, but this will only show the feature tracking results.
In the current release, the MAP-Tk GUI has limited algorithmic capability. It can run bundle adjustment to optimize the data it loads, but it cannot yet create any new features, tracks, landmarks, or cameras. The release does provide a few other spatial transformations. For example, when using metadata in the bundle adjustment tool, the landmarks may not align with the ground plane. The Compute->Align option transforms the solution to best align with the ground plane and rescales the solution to unit variance. Figure 3 applies this operation and makes the projection of images onto the ground plane more stable. After Compute->Align rescales the data, the Reset View tool adapts the World View to the new scale.
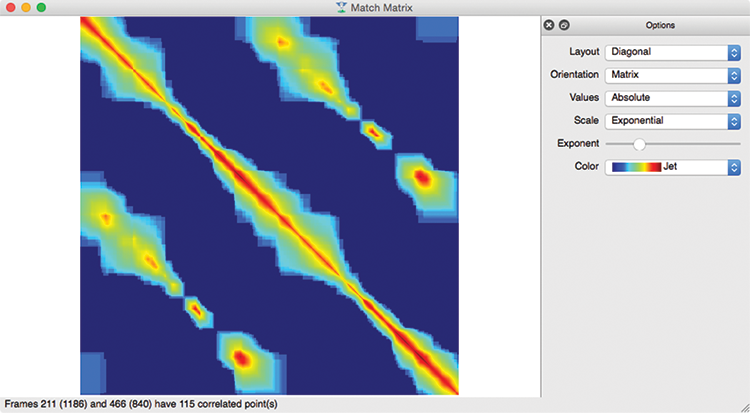
Finally, the View->Match Matrix option (shortcut key “M”) brings up a window that graphically summarizes the number of pairwise feature tracks that persist between each pair of frames. The match matrix helps to assess the quality of the feature tracking results, especially with regard to loop closures. Numerous options are available to adjust this visualization.
Figure 4 shows an example of the match matrix visualization for the CLIF 2007 data. The main diagonal band in the match matrix measures the sequential frame-to-frame tracks, while the off-diagonal bands indicate loop closures, as the sensor revisits the same location on subsequent orbits and re-identifies old tracks.
Conclusions
MAP-Tk is an open-source toolkit and application that provides SfM for aerial video. The software is still in early development, but it already produces useful results on different types of video. MAP-Tk provides a flexible software architecture with dynamic plug-ins. The broader KWIVER collection of tools now shares these plug-ins to make it easy to experiment with new combinations of algorithms.
Kitware encourages community involvement in MAP-Tk. Community members can run MAP-Tk on additional data and discuss experiences on the KWIVER users’ mailing list [13]. Kitware also welcomes members to report issues and make pull requests.
Acknowledgements
Thank you to AFRL/Sensors Directorate for the support of this work via Small Business Innovation Research (SBIR) Contract FA8650-14-C-1820.
References
[1] Fieldhouse, Keith. “KWIVER: An End-to-End Video Analytics Toolkit.” Kitware Source, January 20, 2016. https://blog.kitware.com/kwiver-an-end-to-end-video-analytics-toolkit.
[2] GitHub, Inc. “Kitware / maptk.” https://github.com/Kitware/maptk.
[3] Snavely, Noah. “Bundler: Structure from Motion (SfM) for Unordered Image Collections” http://www.cs.cornell.edu/~snavely/bundler.
[4] Wu, Changchang. “VisualSFM : A Visual Structure from Motion System.” http://ccwu.me/vsfm.
[5] Moulon, Pierre. “openMVG: ‘open Multiple View Geometry.’” http://imagine.enpc.fr/~moulonp/openMVG.
[6] Google, Inc. “Ceres Solver.” http://ceres-solver.org.
[7] Itseez. “OpenCV.” http://opencv.org.
[8] GitHub, Inc. “VXL.” GitHub. https://github.com/vxl/vxl.
[9] GitHub, Inc. “Kitware / vital.” https://github.com/Kitware/vital.
[10] Leotta, Matthew J., Smith, Eric, Dawkins, Matthew, and Tunison, Paul. “Open Source Structure-from-Motion for Aerial Video.” Paper presented at WACV 2016: IEEE Winter Conference on Applications of Computer Vision, Lake Placid, New York, March 7-9, 2016.
[11] U.S. Air Force. “Columbus Large Image Format (CLIF) 2007 Dataset Overview.” https://www.sdms.afrl.af.mil/index.php?collection=clif2007.
[12] “FFmpeg.” https://www.ffmpeg.org.
[13] Kitware, Inc. “Mailing List.” http://www.kwiver.org/mailing-list.
 Matt Leotta is a technical leader on the computer vision team at Kitware. He is the lead developer of MAP-Tk and serves as a principal investigator on an AFRL SBIR award that funds MAP-Tk. Since joining Kitware in 2009, his research has focused on exploiting aerial video. His work has emphasized camera calibration, video stabilization, 3D extraction, and super resolution.