Bridging Data and Visualization: Interactive Scientific Exploration with VTK-Xarray Interoperability
Data interoperability is a fundamental challenge in scientific computing environments. As researchers work with increasingly complex datasets, the ability to move seamlessly between specialized tools for data manipulation, analysis, and visualization becomes essential for efficient scientific workflows. Without effective interoperability, researchers often spend valuable time on format conversions rather than analysis and discovery.
Xarray is a python package that provides access to multidimensional arrays (numpy.ndarray) extended with labels and attributes which is popular because of its powerful and concise interface to access data using these labels. The ability to reference data by meaningful identifiers rather than array indices makes complex data manipulation more intuitive and less error-prone. Xarray data model is heavily influenced by the NetCDF file format. The CF Conventions, released in 2003, define metadata on top of NetCDF files that provide a description of what the data in each variable represents, and the spatial and temporal properties of the data. This standardization enables better interpretation and sharing of scientific datasets across different applications.
In this work, we provide the ability to convert an Xarray annotated with CF Convention metadata to a VTK dataset. This brings the analysis and visualization capabilities of VTK and ParaView to data stored into an Xarray as well as the ability to read formats such as GRIB and Zarr in VTK. By bridging these ecosystems, we enable users to leverage the strengths of both platforms without sacrificing functionality or introducing unnecessary complexity into their workflows.
Using the Xarray VTK accessor in Python
When working with Xarray datasets in your Python workflow, you can seamlessly integrate VTK visualization capabilities using the VTK accessor. This accessor creates a vtkXarrayCFReader connected to the Xarray as shown in the following code fragment.
import xarray as xr
from vtkmodules.util import xarray_support
…
ds_xr = xr.open_dataset(args.input)
reader = ds_xr.vtk.create_reader()
…
We can use a virtual environment with the following set of dependencies to run the previous code snippet:
# Creating a virtual-environement with all the dependencies
uv venv --python 3.12
source .venv/bin/activate
uv pip install xarray netcdf4 cftime cfgrib zarr h5netcdf
# Installing a new enough VTK
# uv pip install vtk>=9.5 # <= not yet available at the time of writing
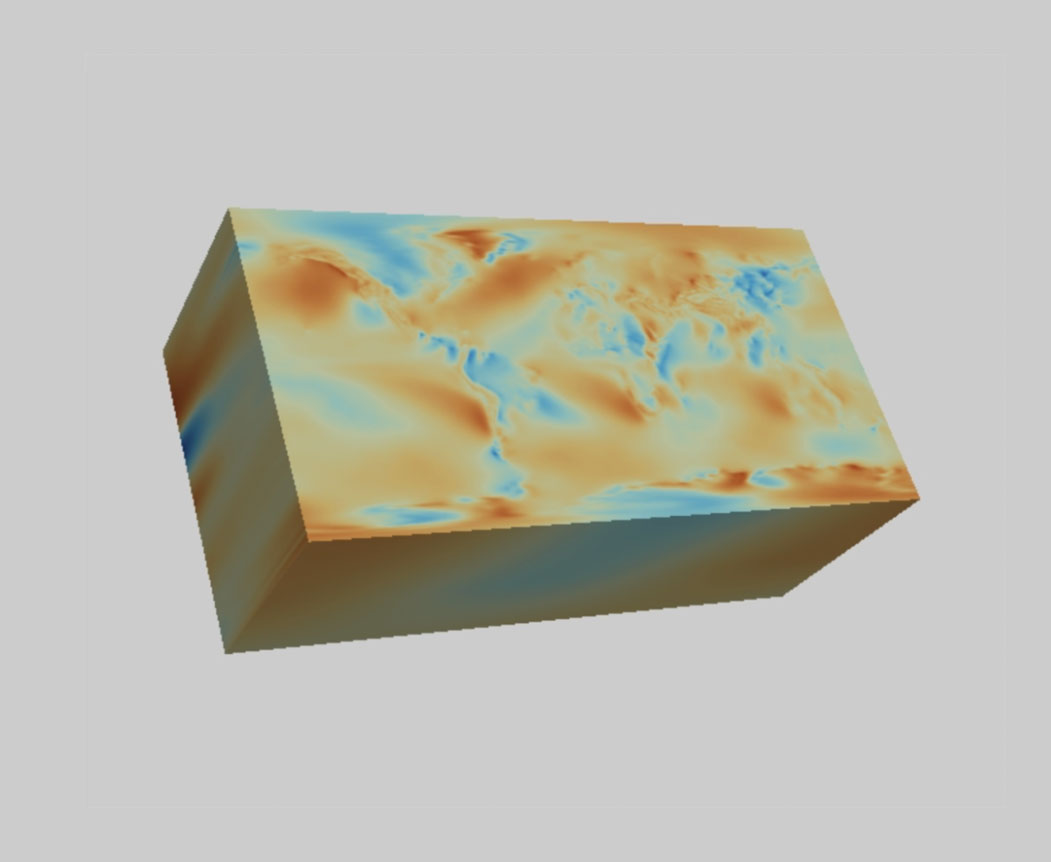
uv pip install 'vtk==9.4.20250331.dev0' --extra-index-url 'https://wheels.vtk.org'Underneath, the vtkXarrayCFReader implements an aggregation pattern, containing a vtkNetCDFCFReader instance to which it forwards function calls. To demonstrate this integration in practice, we have created the xarray_vtk.py example script that showcases how to visualize Xarray data with VTK. As shown in Figure 1, this script reads a dataset and renders it using the VTK pipeline. This implementation is organized into two key functions: main which uses Xarray and Xarray VTK connector to load the data and to create a VTK pipeline to visualize the data respectively; and update which updates the data for given time index.
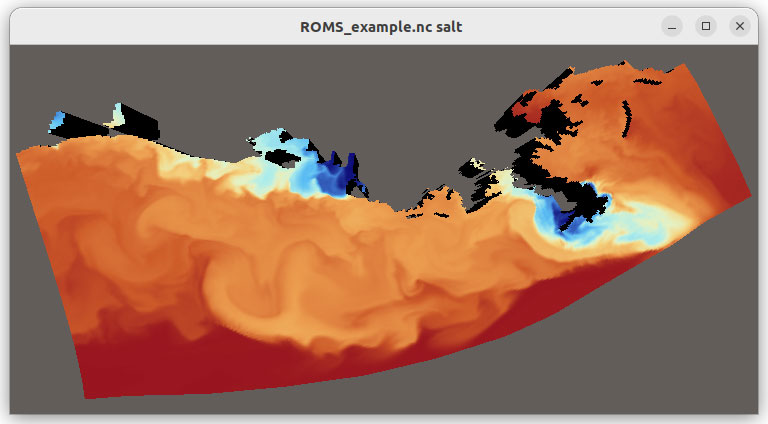
The new functionality also enables you to load additional file formats supported by Xarray such as GRIB, HDF5 with CF conventions, ZARR and COG, in VTK as shown in Figure 2.
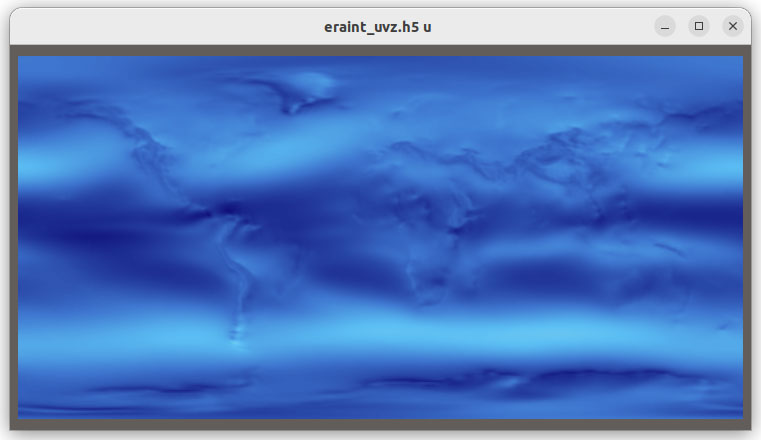
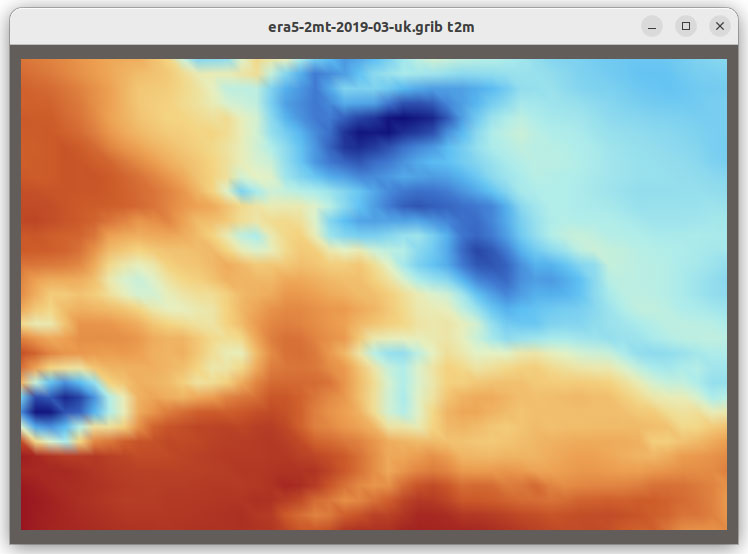
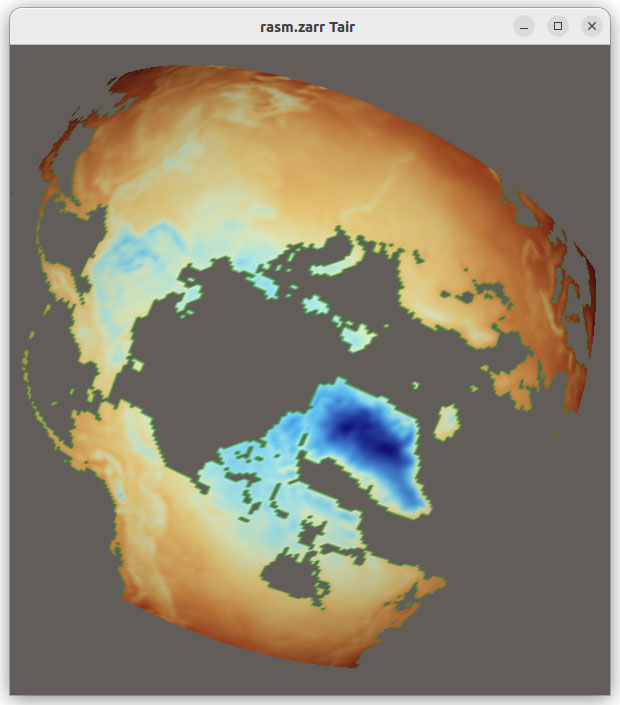
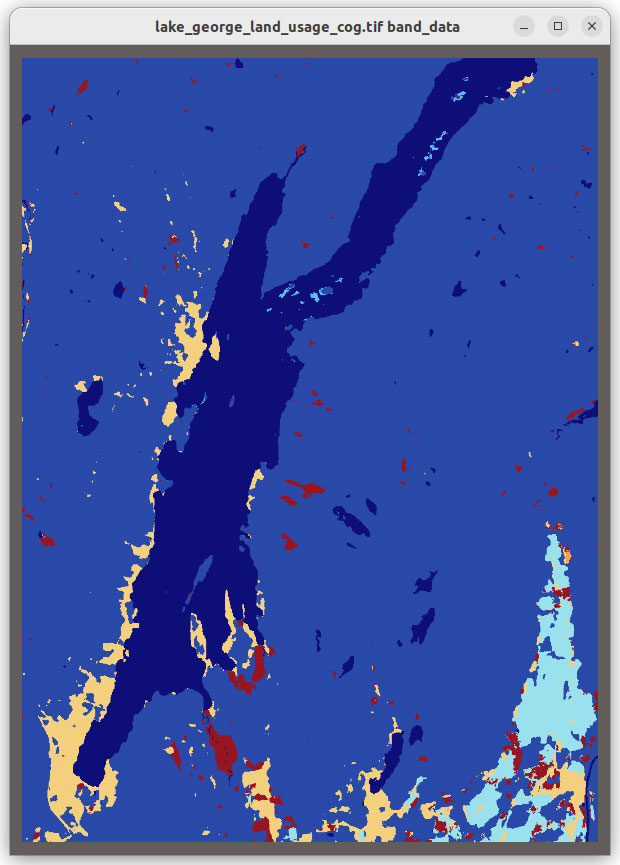
Figure 2: Grib, HDF5 CF Convention, Zarr and COG files visualized in VTK using XarrayCFReader. The images show from left to right, top to bottom: eastward wind component for the entire earth, 2 meter resolution temperature in Kelvin over UK and Ireland; Surface air temperature in Celsius for Africa; and land usage map around Lake George, NY.
Using the XarrayCFReader plugin in ParaView
Since ParaView binaries do not include Xarray by default, integration requires setting up an external Python virtual environment. This approach provides flexibility while maintaining compatibility with ParaView’s existing Python infrastructure (version 5.13.0 or later).
To implement this integration, create a virtual environment in your preferred directory using the same Python version as ParaView (Python 3.12 for current nightly builds) and the same versions of python packages. See
pvpython -m paraview.apps.packagesfor the latest package versions included in the ParaView binary. The following commands utilize the uv utility to establish the environment and install the necessary packages for the upcoming ParaView 6:
uv venv --python 3.12
source .venv/bin/activate
uv pip install xarray cftime cfgrib zarr h5netcdf "numpy==1.26.4" "pandas==2.0.3" "netcdf4==1.6.5"
deactivate
Now download ParaView (nightly version later than 20250319) and start ParaView using the following command:
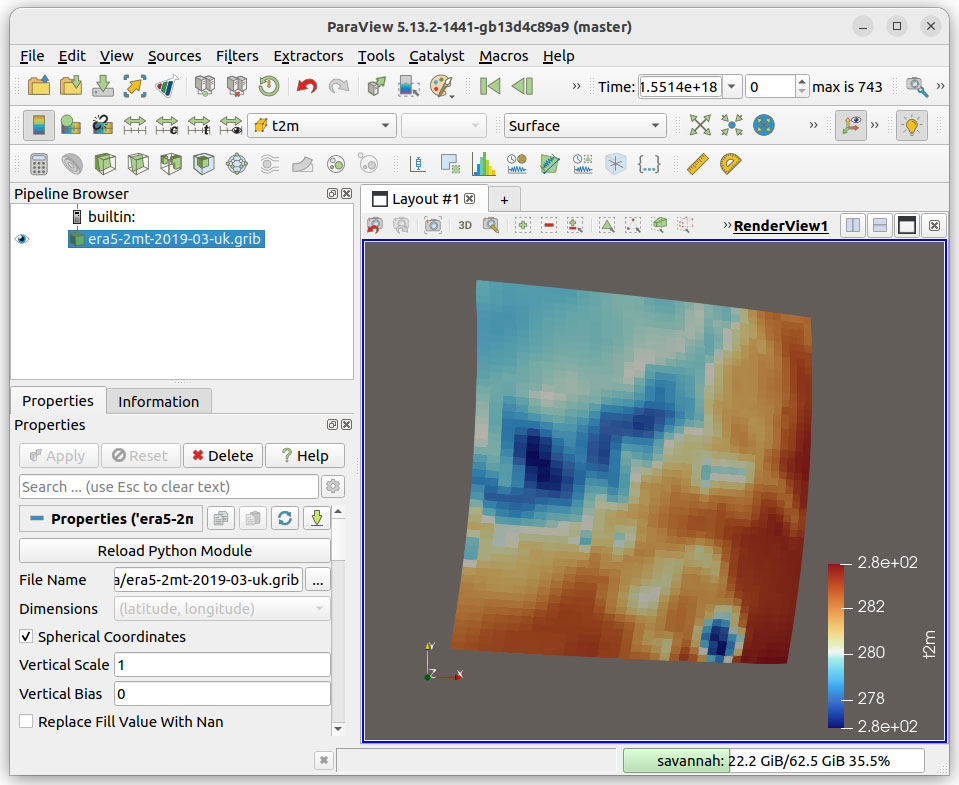
paraview --venv .venvLoad the XarrayCFReader plugin: Use Tools / Manage Plugins, select XarrayCFReader and then press Load Selected. The new XarrayCF Reader will be used to open .nc, .gribb, and .zarr datasets as shown in Figure 3.
Implementation Details
Xarray borrows its data model from NetCDF and can store CF Conventions metadata. Given that we already have a NetCDF CF Reader in VTK (vtkNetCDFCFReader) we use the same code to parse CF Conventions metadata from Xarray and create the correct VTK dataset based on that metadata. When possible, we use data from Xarray directly (zero-copy). To facilitate this integration, we extended vtkNetCDFCFReader with an additional field (Accessor) that can either read data from a NetCDF file (vtkNetCDFAccessor) or or access data directly from an Xarray (vtkXarrayAccessor). This implementation in xarray_support.py provides both the Xarray accessor and vtkXarrayCFReader which is a PythonAlgorithm reader that uses the VTK pipeline (vtkNetCDFCFReader) and the XArray API to load the dataset.
Pan3D Xarray Viewer
Because of VTK-XArray interoperability, we can now bring XArray data into interactive visualizations. Pan3D library bridges VTK and XArray through trame and enables interactive visualization on desktop, Jupyter, HPC, and cloud deployments. It also enables seamless data exploration within Jupyter Lab, locally or remotely in cloud or HPC environments. An example of how to leverage Pan3D with Xarray is shown in Figure 4.
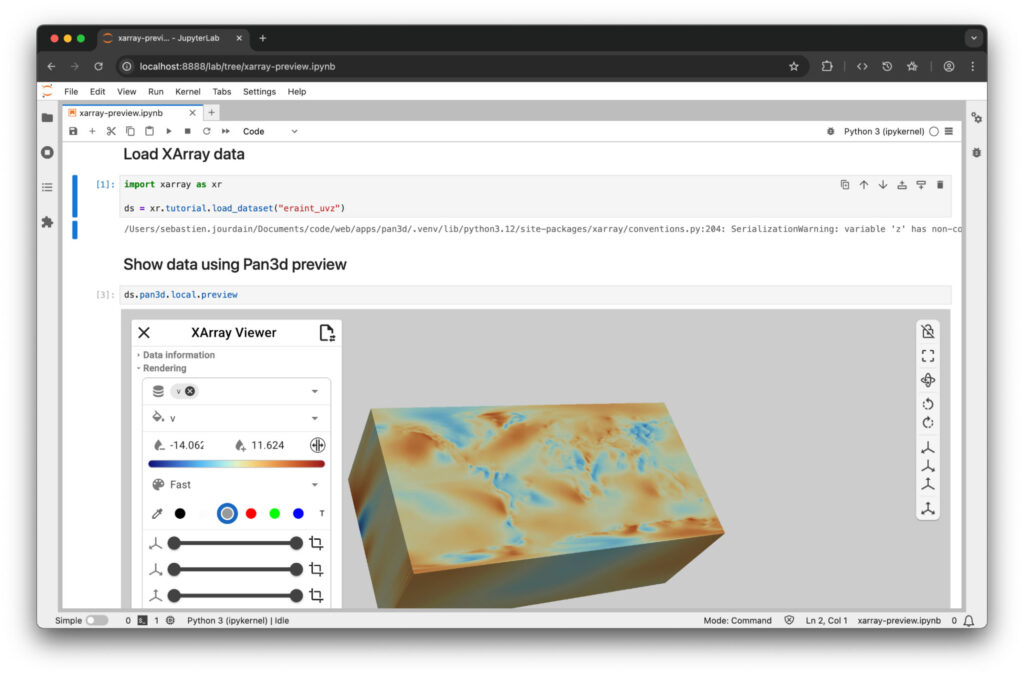
To run Pan3D inside Jupiter Lab like shown in figure 4, we setup a virtual environment by running the following command:
# Setup venv
uv venv
source .venv/bin/activate
uv pip install "pan3d[all]" jupyterlab

# Start jupyter
jupyter lab
The XArray viewer can be initialized with a single line of code (see the command line below), providing immediate access to interactive data exploration through slicing, filtering, and projection operations. This viewer supports multiple launch methods, including direct integration within Python code and standalone execution from the command line. When launched as a command-line application as shown in Figure 5, it offers flexible data source options, supporting local file paths, remote URLs, and built-in XArray tutorial datasets.
# Execute the "preview" viewer from command line
xr-viewer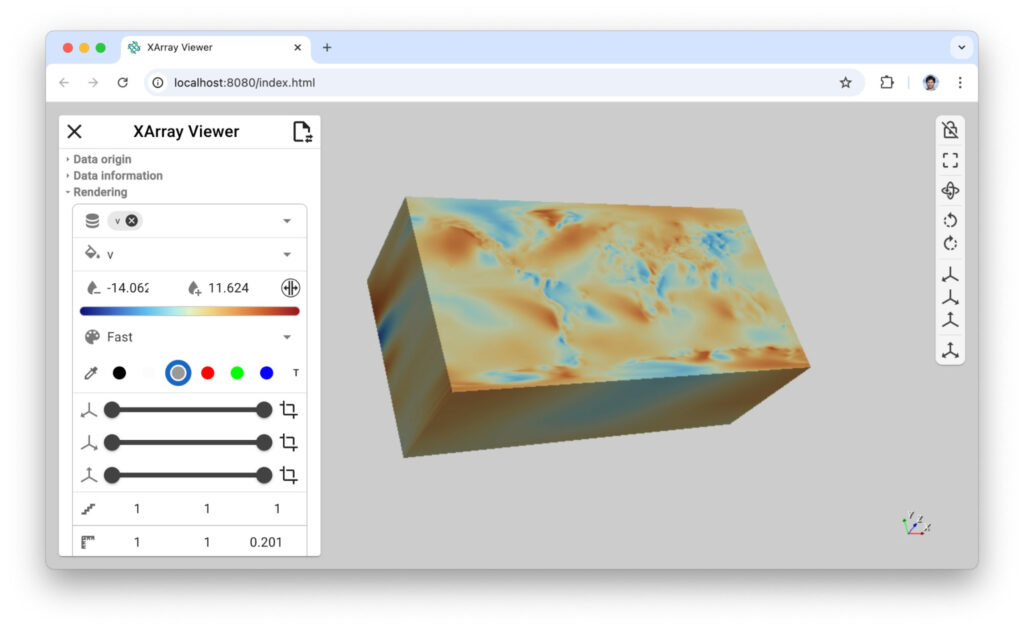
The viewer supports exporting data descriptors to preserve visualization states for later sessions and enables advanced analysis through specialized Pan3D explorers, such as the Slice Explorer shown in Figure 6 and Contour Explorer as shown in Figure 7.
# Execute the "slicer" explorer from the command line
xr-slicer

# Currious about the options
xr-slicer --help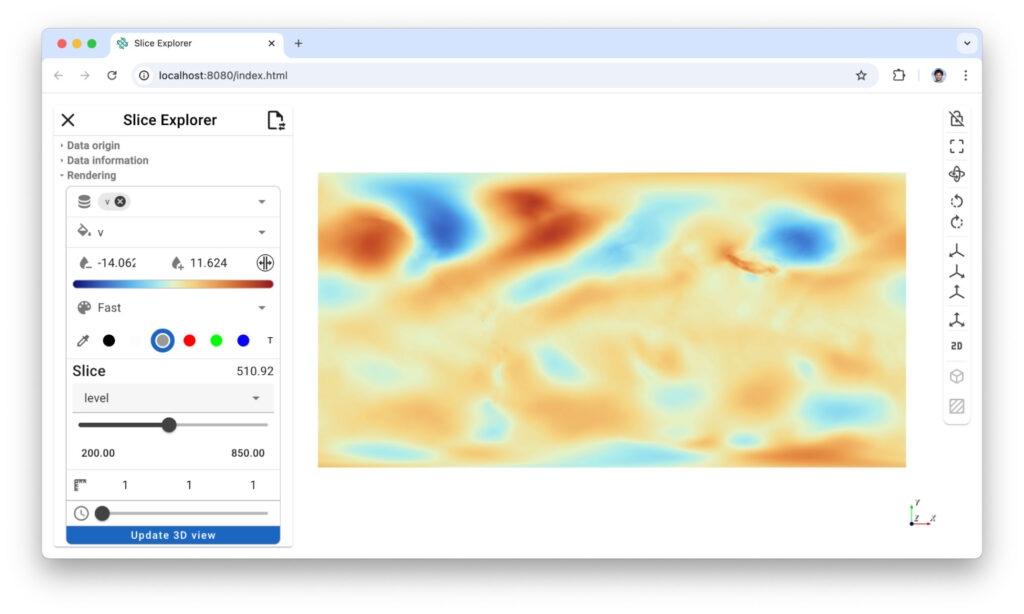
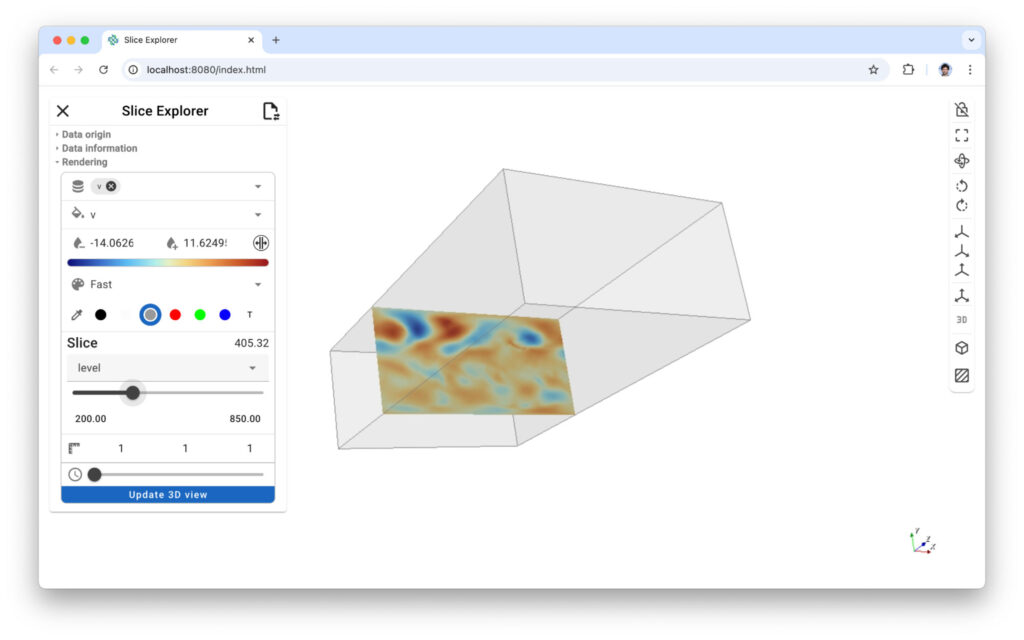
Figure 6: Xarray slicer lets you cut your data along any axis and either look at your data in 3D or 2D.
# Execute the "contour" explorer from the command line
xr-contour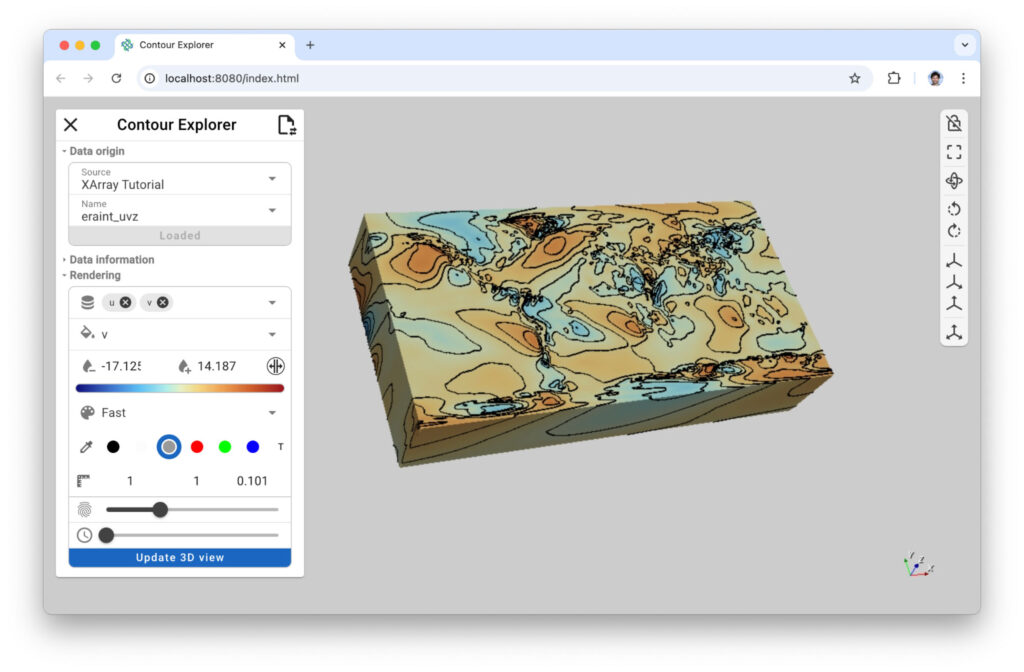
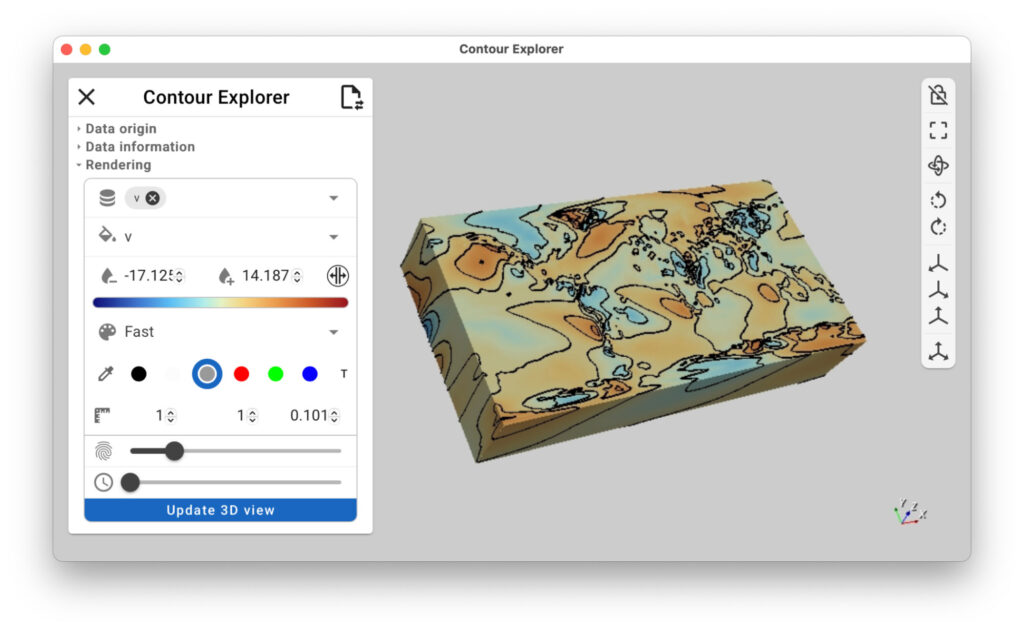
Figure 7: (left) Xarray contour lets you draw iso-lines onto your dataset to highlight field distribution. (right) xr-contour command line with –app argument to run the app as a standalone application.
Conclusion
The XArray-VTK integration bridges two powerful scientific computing ecosystems, enabling researchers to visualize and analyze multi-dimensional data without format conversions. This work supports numerous file formats and provides visualization capabilities across different computing environments through trame and Pan3D.
For implementation details, examples, and documentation, visit our GitHub repositories (https://github.com/Kitware/pan3d; https://github.com/Kitware/trame ). We welcome contributions and feedback to improve these tools for the scientific computing community.