Climate Data for the Masses

As the pace of climate change is expected to accelerate, the impact of these changes will resonate through a broad range of fields including public health, infrastructure, water resources, and many others. To understand variables affecting climate, scientists often rely on the output from climate models which uses quantitativemethods to simulate the interactions of the atmosphere, oceans, and land surface. Over the last few years climate simulations has produced a wealth of climate simulation data, including output from high-resolution, long-term, climate change projections performed as part of the U.S. Global Change Research Program and the Coupled Model Intercomparison Project (CMIP). It is essential that data from climate simulations is easily accessible so that a broader audience can participate in the policy and decision making processes.
Recently, we (Kitware, in collaboration with NYU-Poly) have leveraged ParaViewWeb, VisTrails, UV-CDAT, Earth System Grid Federation (ESGF), and other web technologies to provide a web based tool to enable users to access, query and visualize climate datasets from multiple sources. The dataflow user interface is inspired by dataflow systems like Yahoo! Pipes, which has become a popular tool for combining, filtering, and outputting RSS, and XML data from various sources. Figure 1 shows an example dataflow created using the pipeline interface to fetch a list of datasets available from an ESGF source.
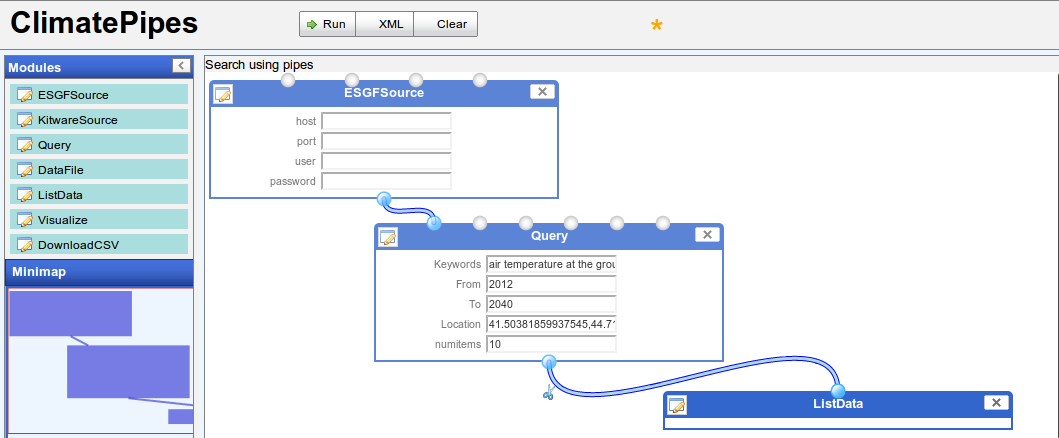
Figure 1 Dataflow Interface
We also developed a second, more explicit, interface, which allowed users to visually select regions for data query purposes, shown in Figure 2. This form can be used in lieu of the data-flow interface, and will automatically generate the corresponding dataflow after the user configures the Web form.
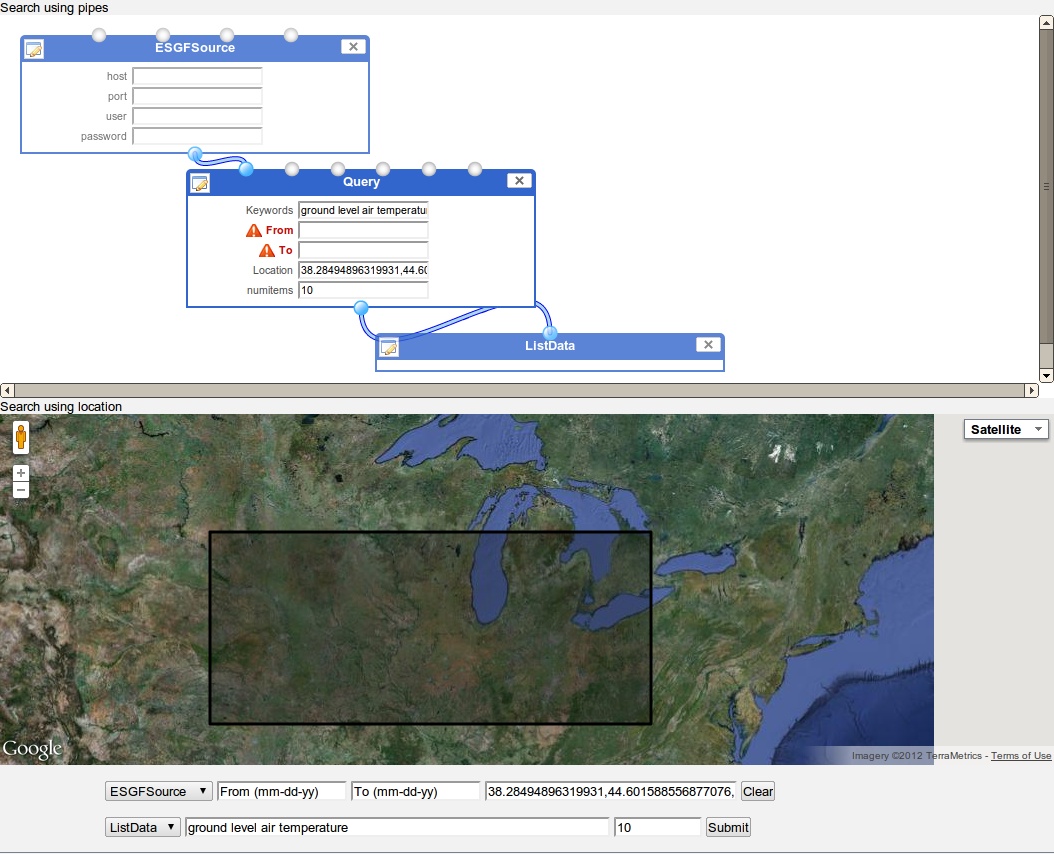
Figure 2 Web form interface and automatic generation of pipes workflow (above)
An efficient query result for user entered query is generated by leveraging our ad-hoc algorithm developed using open source Natural Language Toolkit (NLTK). A relevancy score for each data item in the result-set is calculated by our ad-hoc relevance score generator that uses text from metadata and keywords from the input query to formulate a score between 0 and 1, 1 being the highest (see Figure 3).
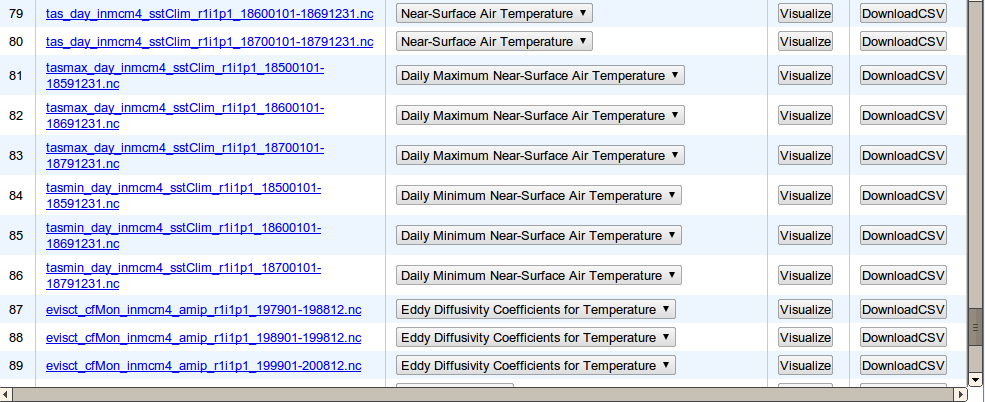
Figure 3 Table view showing data, sorted by relevancy score.
Results of a query is displayed in a table view (see Figure 3) or a interactive google maps widget (see Figure 4). The table view includes buttons to either download the data in CSV format, or visualize the data.
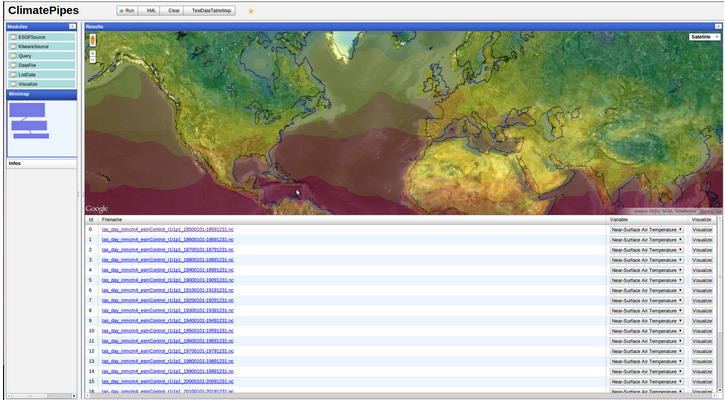
Figure 4: Climate data visualized over Google Maps
We successfully demonstrated our tool to the researchers from climate and non-climate community and received some really good feedback. We would like to thank Dean Williams and Charles Doutriaux for providing help on accessing data from ESGF.
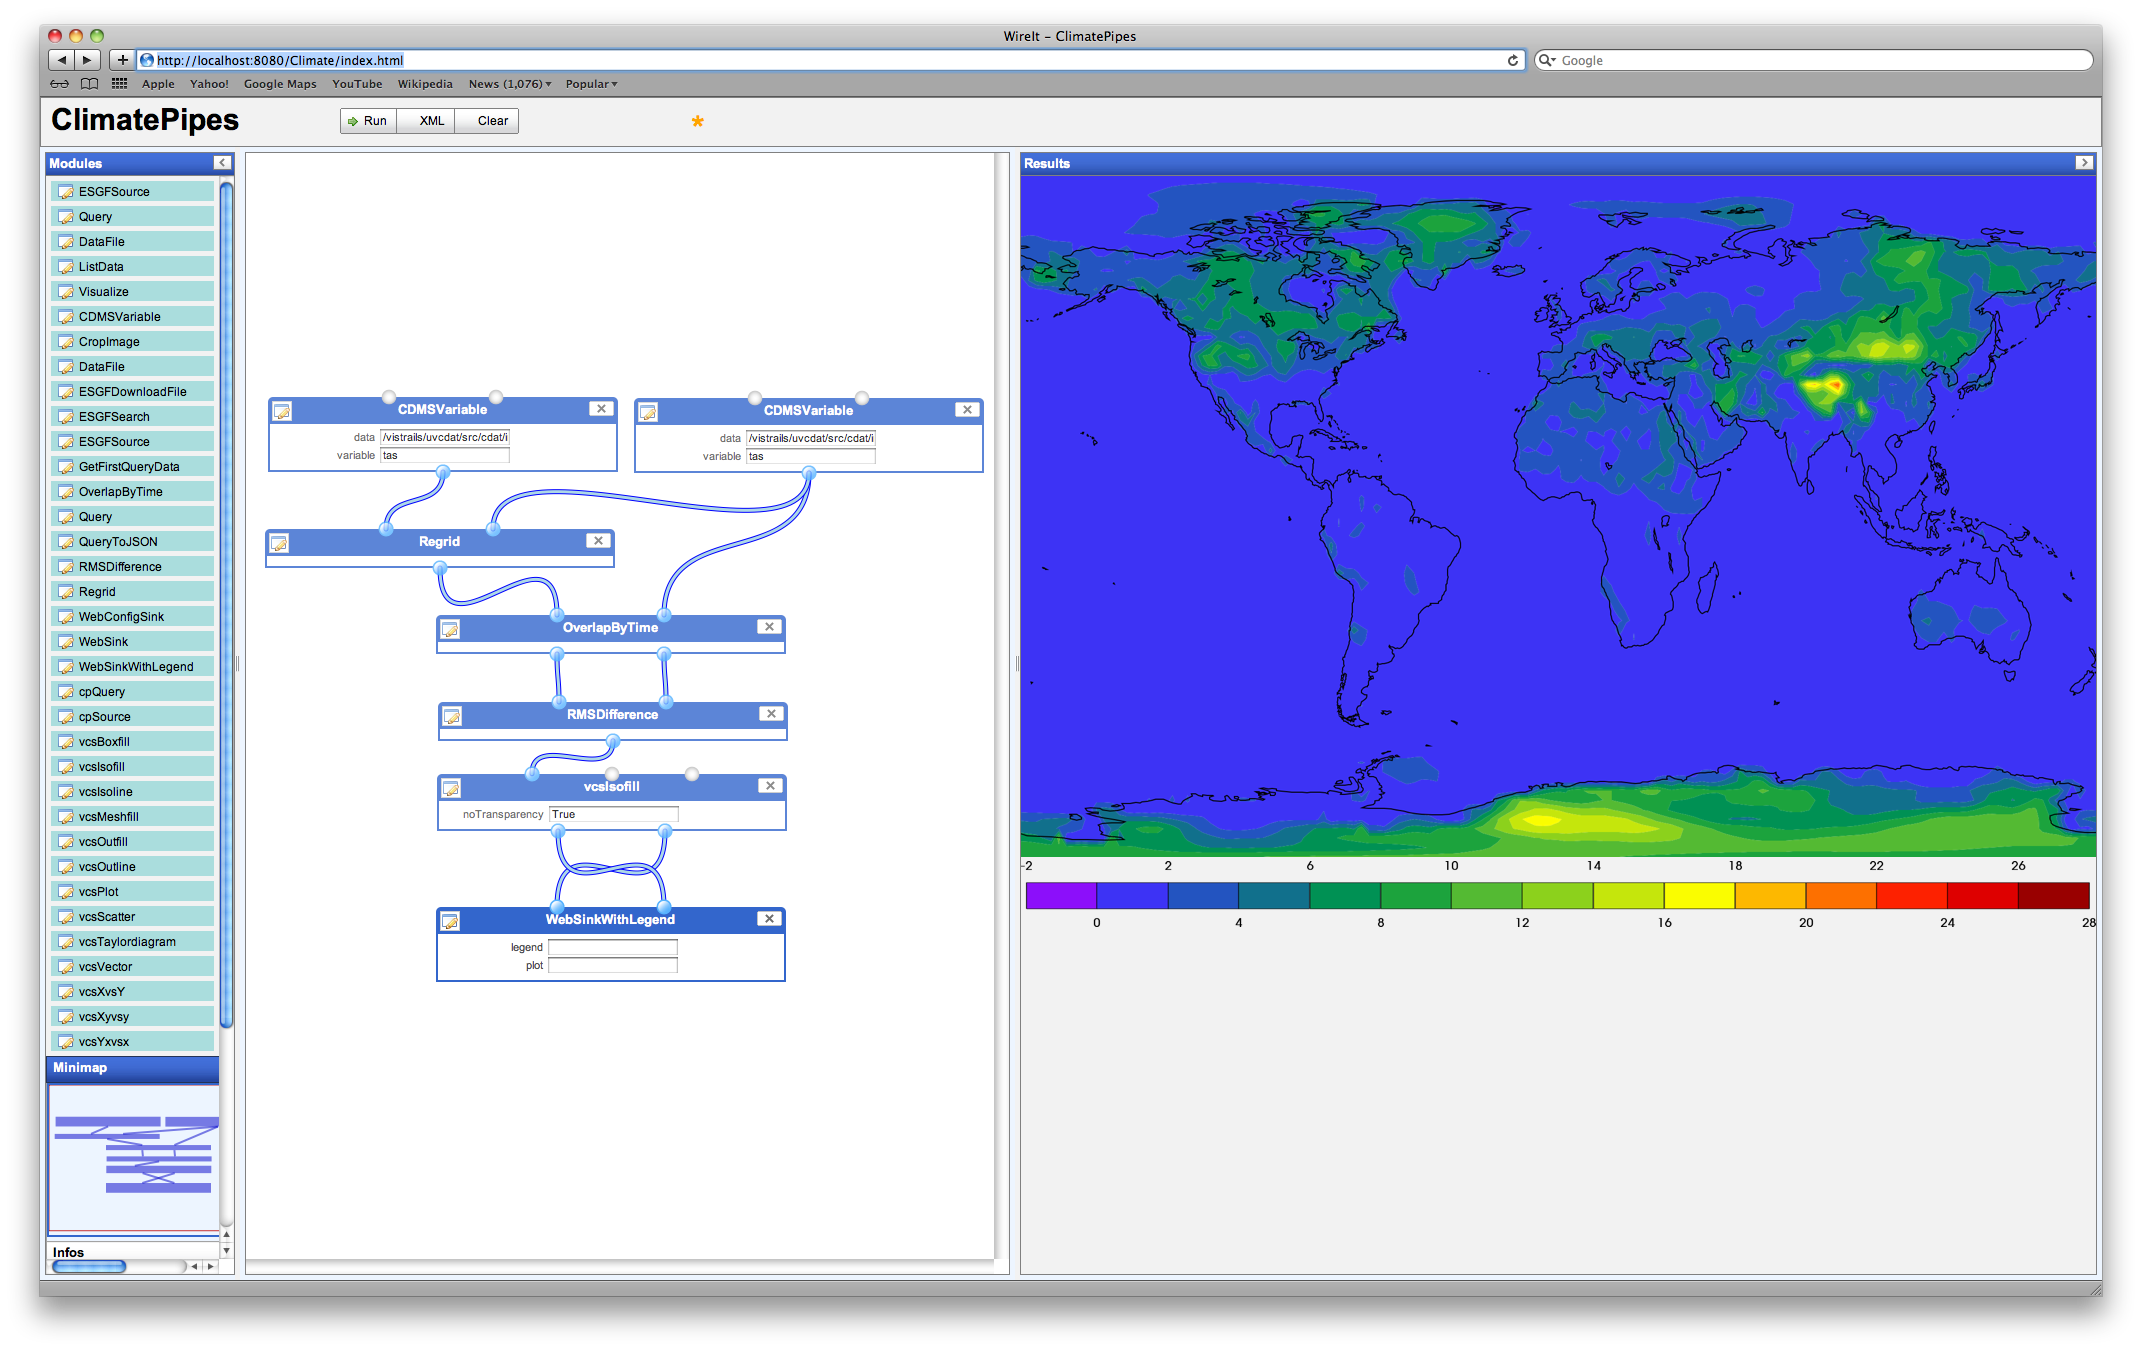
Figure 5: An advanced use case of ClimatePipes that involves regridding one dataset to match the other, computing the overlapping time series, and then computing the difference between the two, displaying it visually with a legend.
Project team:
From Kitware: Berk Geveci, Aashish Chaudhary, Nikhil Shetty, Sebastien Jourdain
From NYU-Poly: Claudio Silva, David Koop, Ben Burnett, Emanuele Santos
This work has been supported by the Department of Energy (DOE) under award number DE-SC0006493.