Explore Multi-Channel Large Images in Jupyter
We use the large_image library to visualize and process whole slide images (WSI) and geospatial images, including those with multiple frames from axes such as z-stack, time, and channels. The Girder plugin and the HistomicsUI viewer enable selecting, viewing, and compositing images from these axes, using a dedicated and intuitive UI.
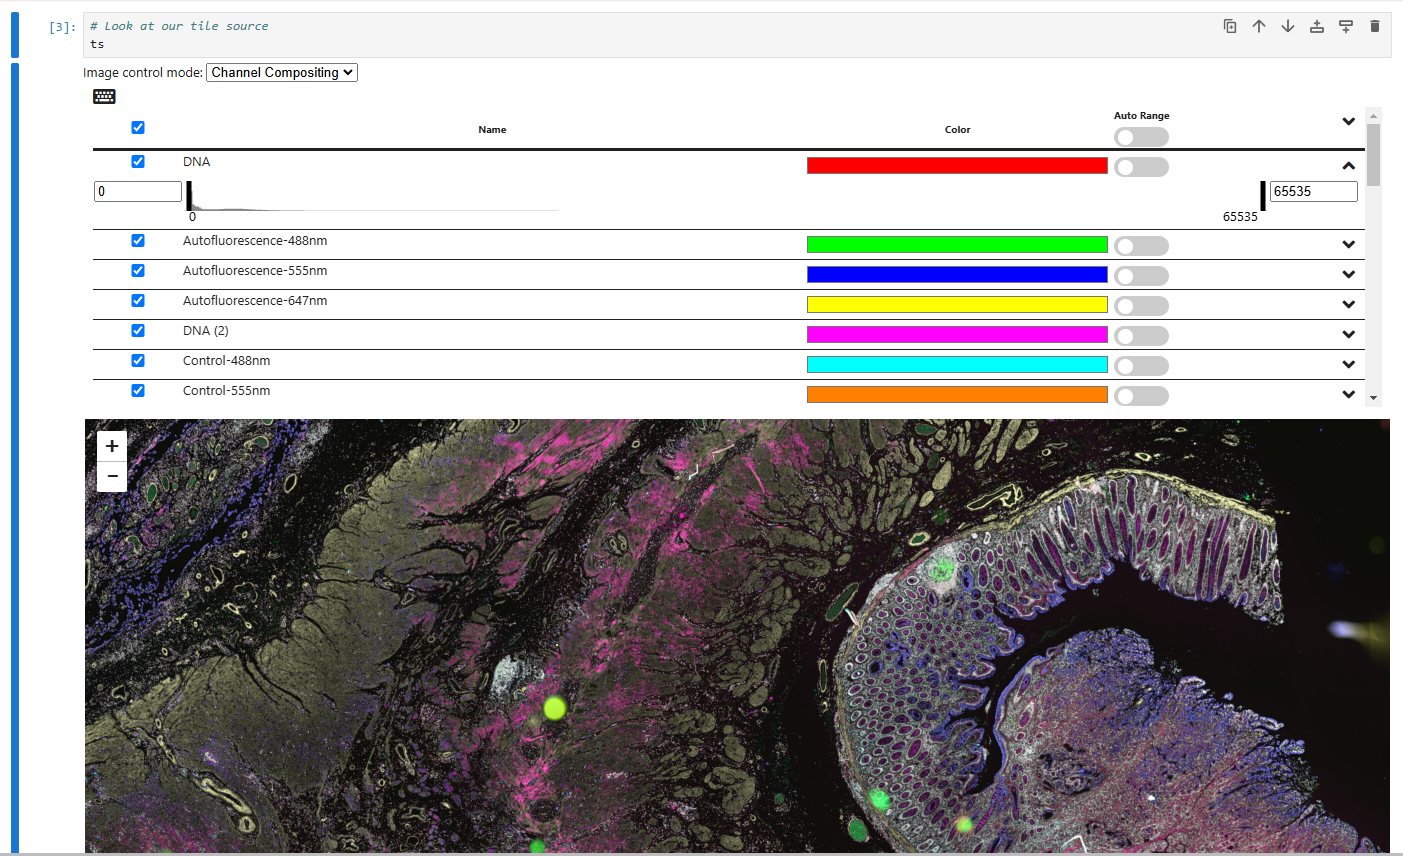
Jupyter Notebooks are a handy way to explore imaging data, but thus far, our Jupyter widget has lacked this ability, only allowing access to a single sequence of all frames without regard to their conceptual axes. You can now use the enhanced frame selector component to view multi-frame images directly in your notebooks. The original component had just a frame slider that enabled viewing of any individual frame on its own; now, you can composite channels and bands just like you can in the Girder plugin or HistomicsUI.

In a Jupyter Notebook, multi-channel images can be composited dynamically with a well-developed set of controls. This can also work for z-stacks, time series, and other multi-frame images.
To try this out, see a sample Jupyter notebook here:
https://girder.github.io/large_image/notebooks/frame_viewer_example.html
Or run it on Google Colab by clicking here: https://colab.research.google.com/github/girder/large_image/blob/master/docs/notebooks/frame_viewer_example.ipynb
These efforts are part of our ongoing mission to connect you with your data. If you want to discuss your large image visualization and analysis problems with us, we are here for you, so get in touch!