New CMake Instrumentation Feature Provides Detailed Timing of Builds
Overview
CMake 4.0 introduces a new experimental feature: build process instrumentation. This feature enables detailed tracking of the entire CMake workflow—including configure time, build execution, testing, and installation—providing developers and teams with actionable insights into build performance. With fine-grained metrics such as target-specific compile times and resource usage, this system is ideal for identifying bottlenecks and areas for improvement. By enabling telemetry with this feature, projects can gain insight into build performance over time, across teams or CI systems. Instrumentation hooks allow integration with third-party tools by supporting user-defined callbacks, making it easy to extend and customize the data collection pipeline.
This blog will introduce the new feature and readers should gain an understanding of how to use CMake Instrumentation to gain insight into project performance.
Using CMake Instrumentation
There are three main steps necessary to make use of the Instrumentation feature.
1. Enable the Experimental Instrumentation Feature
Because this feature is still experimental, you need to set an experimental flag in the CMake project in order to enable it. (Note, this value will change with future CMake releases, see docs for the version you are using for the correct value.)
set(CMAKE_EXPERIMENTAL_INSTRUMENTATION a37d1069-1972-4901-b9c9-f194aaf2b6e0)2. Create Instrumentation Queries
There are two types of queries a user can write to enable collection of instrumentation data.
Project queries should be defined in the project’s CMake code with the cmake_instrumentation command.
cmake_instrumentation(
    API_VERSION 1
    DATA_VERSION 1
    QUERIES dynamicSystemInformation staticSystemInformation
    HOOKS postCMakeBuild postInstall postTest
    CALLBACK ${Python_EXECUTABLE} ${CMAKE_SOURCE_DIR}/instrument.py
)
The parameters include an API_VERSION and DATA_VERSION (both are always 1 for now) to control the version protocol. A QUERIES parameter defines optional data to collect that would be omitted by default. HOOKS is a list of triggers at which the data should be collated and parsed. CALLBACK specifies a user-defined callback command to parse the data at each HOOK. If you want to control the indexing time manually, leave out the HOOK parameter and call ctest --collect-instrumentation <buildDir> manually.
User queries are queries that will apply to all of a user’s CMake projects. These take the form of JSON files placed in a user’s CMake config directory under instrumentation-a37d1069-1972-4901-b9c9-f194aaf2b6e0/v1/query. The long UUID in this path is the same as the UUID we set in Step 1. When the feature is no longer experimental, the path will be shortened to instrumentation/v1/query.
{
    "version": 1,
    "queries": ["dynamicSystemInformation", "staticSystemInformation"]
    "hooks": ["postCMakeBuild", "postInstall", "postTest"]
    "callbacks": ["/path/to/python /path/to/instrument.py"]
)
The keys correspond to those in the cmake_instrumentation command.
3. Define Callback Functions to Read the Data
CMake passes one additional argument to the callback functions provided by instrumentation queries: the path to an instrumentation index file. The index file serves as an entry point to reading the data. After every callback has been executed, CMake cleans up the data output files on its own.
Example
We’ve put together a sample project with a callback script to serve as an example for writing your own instrumentation callbacks. It also includes a small test CMake project we will use to demonstrate this feature.
An Example Callback
The included callback script: instrument.py copies the instrumentation data to an instrumentation/ subdirectory of the build tree so it can be inspected after CMake removes it. Additionally, it uses a modified version of the ninjatracing project to generate a JSON file in the Google trace format so we can visualize the timing data.
from cmaketracing import cmaketracing
import json
import os
import shutil
import sys

if name == "main":
    # The instrumentation feature will pass the path to an index file to this callback
    index = sys.argv[1]

    # Get the buildDir and dataDir from the index file
    with open(index) as f:
        data = json.load(f)
        buildDir = data["buildDir"]
        dataDir = data["dataDir"]

    # Get a unique output directory name based on the index filename
    indexName = os.path.basename(index).split(".")[0]

    # Create an output directory that CMake won't clear, to copy the files into
    outputDir = os.path.join(buildDir, "instrumentation")
    indexDir = os.path.join(outputDir, indexName)
    for d in [outputDir, indexDir]:
        if not os.path.exists(d):
            os.makedirs(d)

    # Copy all the instrumentation data into the newly created output directory
    for snippet in data["snippets"]:
        shutil.copyfile(
            os.path.join(dataDir, snippet),
            os.path.join(indexDir, snippet)
        )
    shutil.copyfile(
        index,
        os.path.join(indexDir, os.path.basename(index))
    )

    # Generate a trace.json file to visualize timing data
    cmaketracing(index, os.path.join(indexDir, "trace.json"))
Collecting Instrumentation Data on our Example Project
After cloning the sample project, configure and build the included CMake project. From the example subdirectory, run:
cmake -Bbuild && cmake --build build -j 2Because we enabled postCMakeBuild under our HOOKS in the CMakeLists.txt, indexing will occur after the cmake --build build command. Let’s take a look at the collected data under build/instrumentation/ in the build tree to see what it collected.
There should be one subdirectory named index-[timestamp] Whenever our instrument.py runs, it creates a new subdirectory here. The contents should look something like this:
cmakeBuild-ec74be4c6427cdd530652025-04-08T14-16-55-0748.json
compile-61687789b71f29134e3f2025-04-08T14-16-55-0669.json
compile-91446c32823d06f19c152025-04-08T14-16-54-0854.json
configure-d3db67f661db6d445eb42025-04-08T14-16-54-0003.json
custom-2a01d48fead2dab11a0a2025-04-08T14-16-54-0205.json
custom-55ddf43960e0561327032025-04-08T14-16-54-0552.json
custom-aa313e64139cc7624d1e2025-04-08T14-16-54-0278.json
custom-faabfa38a66e7d844c6c2025-04-08T14-16-54-0704.json
generate-d3db67f661db6d445eb42025-04-08T14-16-54-0023.json
index-2025-04-08T14-16-55-0748.json
link-02cbdbe042219f1edb3f2025-04-08T14-16-54-0890.json
link-ac2596d7733682d61b6e2025-04-08T14-16-55-0726.json
trace.json
The cmakeBuild snippet file will contain information about the overall cmake --build build command we ran. The compile, link, and custom snippet files contain information about each compile, link and custom command respectively. The configure and generate files correspond to, as you’d expect, the configure and generate steps that occurred as part of our cmake -Bbuild
Taking a closer look at compile-1db007c87f3dfbfed80f2025-04-08T10-23-07-0160.json, we can see what information it collected while compiling million.cxx
{
    "command" : "\"/usr/bin/c++\" … \"CMakeFiles/million.dir/million.cxx.o\" … \"-o\" \"CMakeFiles/million.dir/million.cxx.o\" …",
    "config" : "Debug",
    "duration" : 1303,
    "dynamicSystemInformation" :
    {
        "afterCPULoadAverage" : 0.44,
        "afterHostMemoryUsed" : 8907248.0,
        "beforeCPULoadAverage" : 0.44,
        "beforeHostMemoryUsed" : 8909804.0
    },
    "language" : "C++",
    "outputSizes" :
    [
        3040
    ],
    "outputs" :
    [
        "CMakeFiles/million.dir/million.cxx.o"
    ],
    "result" : 0,
    "role" : "compile",
    "source" : "…/test-instrumentation/million.cxx",
    "target" : "million",
    "timeStart" : 1744104808532,
    "version" : 1,
    "workingDir" : "…/test-instrumentation/build"
}
The index file in our output directory is a copy of the index file passed to instrument.py. Taking a look inside shows the general format of these files that user-defined callbacks should be expected to handle. If we enabled staticSystemInformation under QUERIES, that information would show up here as well.
{
"buildDir" : "…/test-instrumentation/build",
"dataDir" : "…/test-instrumentation/.cmake/instrumentation-a37d1069-1972-4901-b9c9-f194aaf2b6e0/v1/data",
"hook" : "postCMakeBuild",
"snippets" :
[
"link-6c1a64f6d803aea3e8a62025-04-08T10-23-07-0230.json",
"compile-376bfdec8c017be9e6ff2025-04-08T10-23-07-0212.json",
"custom-61211194d40f3836a9952025-04-08T10-23-05-0636.json",
"custom-fd5c533371d8e7ea82dd2025-04-08T10-23-04-0608.json",
"custom-bbcd9ed7685d2f869c9b2025-04-08T10-23-02-0580.json",
"configure-128096b0a40c3622dad22025-04-08T10-23-01-0500.json",
"cmakeBuild-9ec5874c81597e60f29a2025-04-08T10-23-07-0280.json",
"link-93f30c0e06b1cd8cd6892025-04-08T10-23-07-0259.json",
"compile-1db007c87f3dfbfed80f2025-04-08T10-23-07-0160.json",
"generate-128096b0a40c3622dad22025-04-08T10-23-01-0540.json",
"link-a298274557737f1963ff2025-04-08T10-23-07-0222.json",
"custom-9b79dfaa10abdc2d82d42025-04-08T10-23-02-0584.json",
"link-5f6174ff49dc20bb0bc12025-04-08T10-23-07-0236.json"
]
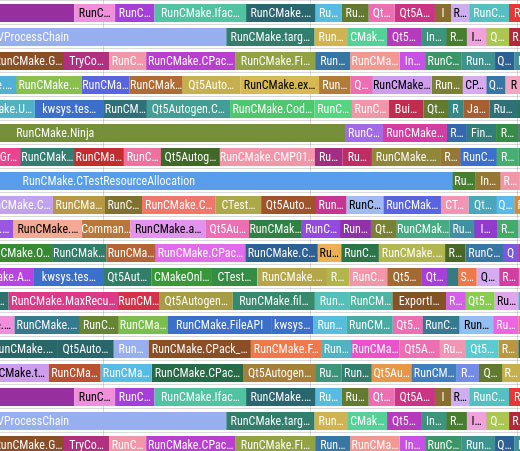
}Finally, the generated trace.json can be opened in https://ui.perfetto.dev/ or about://tracing in a Chrome browser to see a visualization of our build:
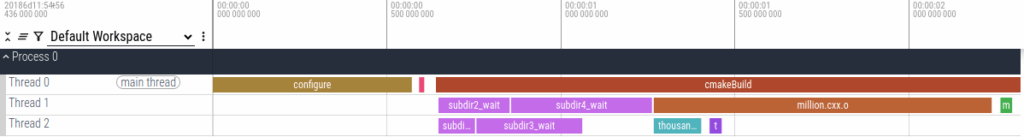
If you ran the configure and build steps individually, you might see a gap between the the configure and cmakeBuild blocks. We can also see easily in the visualization that our compilation of million.cxx and thousand.cxx depend on the completion of all the custom commands.
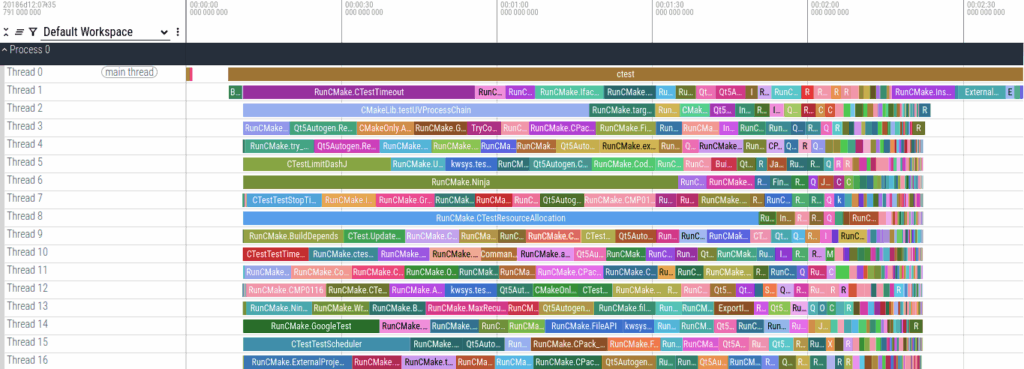
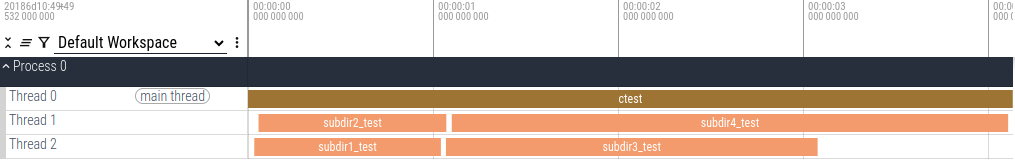
In addition to metrics about configure and build time, we can collect information about test and install. Certain snippet files contain special information. For example, the snippet data for each test will include the name of the test that ran. You can see what data is collected for which snippets in the documentation. Let’s run ctest --test-dir build -j 2 and look at the resulting trace.json file:
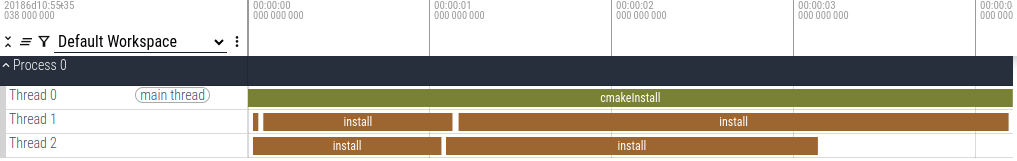
The sample project has CMake’s parallel install enabled (available since 3.31), we can visualize that too (cmake --install build -j 2):
Running The Example Callback on Another Project
We can copy the cmake_instrumentation call to another CMake project, replacing ${CMAKE_SOURCE_DIR}/instrument.py with the full path to the file. Be sure to add a find_package(Python) as well or change ${Python_EXECUTABLE}
doing all this ends compile with
It looks like it is failing to run the callback script.
The example project defines the callback with:
CALLBACK ${Python_EXECUTABLE} ${CMAKE_SOURCE_DIR}/../instrument.py
On Windows, I would expect to see this
unexpected errorif${Python_EXECUTABLE}evaluated empty.Most likely, the
find_package(Python COMPONENTS Interpreter)call failed to find the interpreter. You could try replacing${Python_EXECUTABLE}in the callback with a known path to a Python interpreter.