Visualize Raw Image Data to Understand How Your ML Models Think
When running machine learning models on image data, understanding what drives your model’s decisions is critical. The feature vectors used to train and interpret these models can reveal important patterns, including how features are distributed, how they cluster, and how they map back to the original images. Without visibility into these relationships, researchers risk missing hidden biases or misinterpreting results.
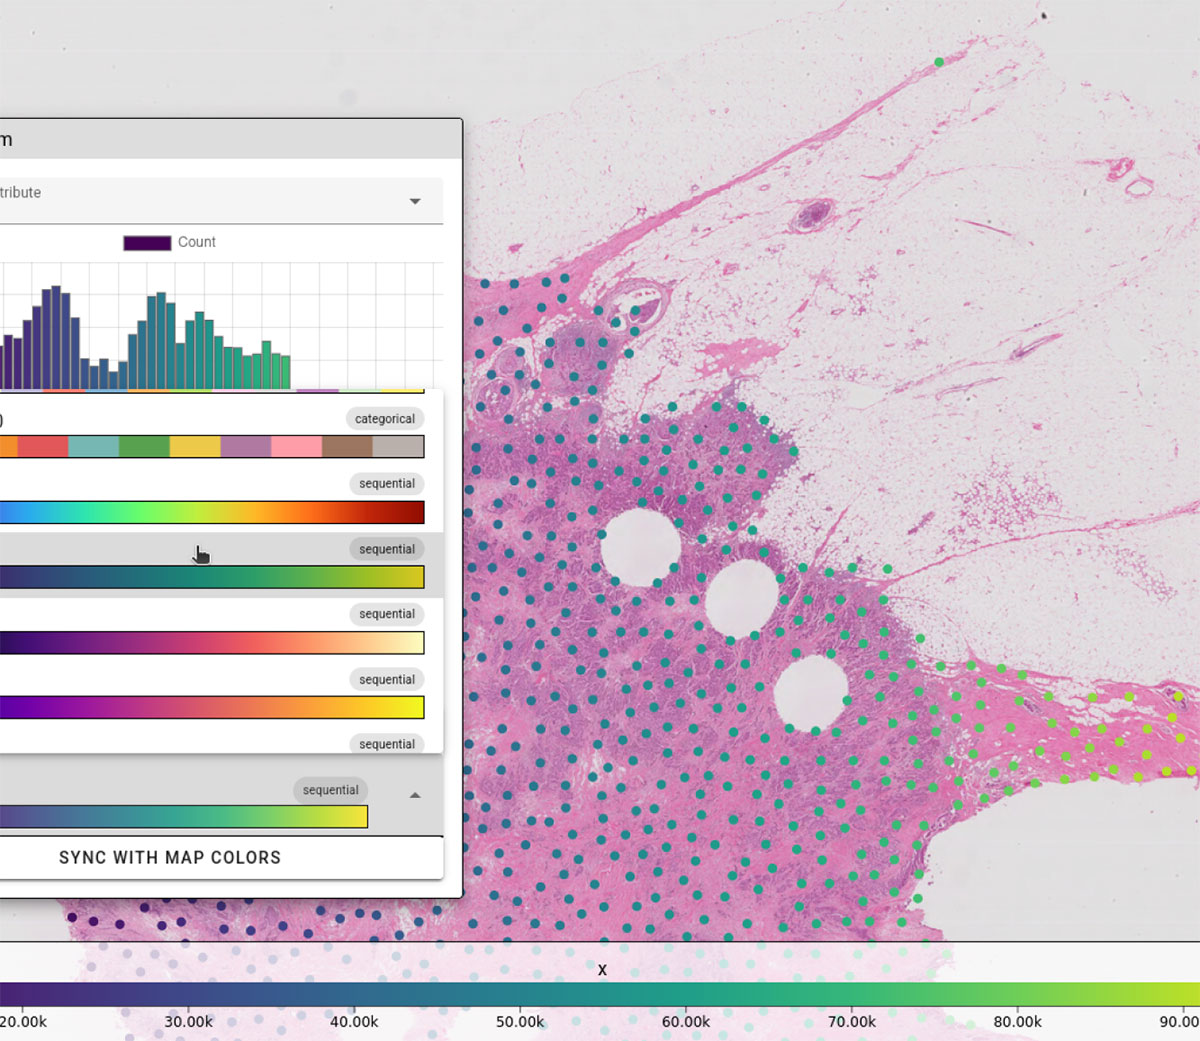
In this webinar, our experts will demonstrate new techniques for interactively exploring raw image data and the feature vectors derived from it. You’ll learn how to apply statistical algorithms and visualization tools to better understand your data, diagnose feature performance, and refine model outcomes. These methods facilitate connecting quantitative feature representations back to the visual context of the source images, bridging the gap between computation and comprehension.
Attendees will learn how to:
- Learn how to visualize and analyze feature vector distributions to better understand ML model behavior.
- Discover techniques to correlate extracted features with the original image data for model validation.
- Gain insights into using statistical algorithms and visual exploration for improved interpretability.

understand your machine learning modelsthrough interactive image and feature visualization!