New in ParaView 5.11: Advanced Multi-Channel Volume Visualization
Previous versions of ParaView supported the creation and editing of 1-dimensional color and opacity transfer functions for volume rendering. With the upcoming version 5.11, ParaView’s user interface will allow you to define and edit 2-dimensional transfer functions for volume visualization of structured data. 2D transfer functions enable the color and opacity of a data sample to be determined by the value of two separate scalar fields. This enables the visualization to compare and contrast spatial features of the two fields. The new functionality also provides for a special mode where a scalar field can be coupled with its gradient magnitude that enhances “edges” in the scalar values.
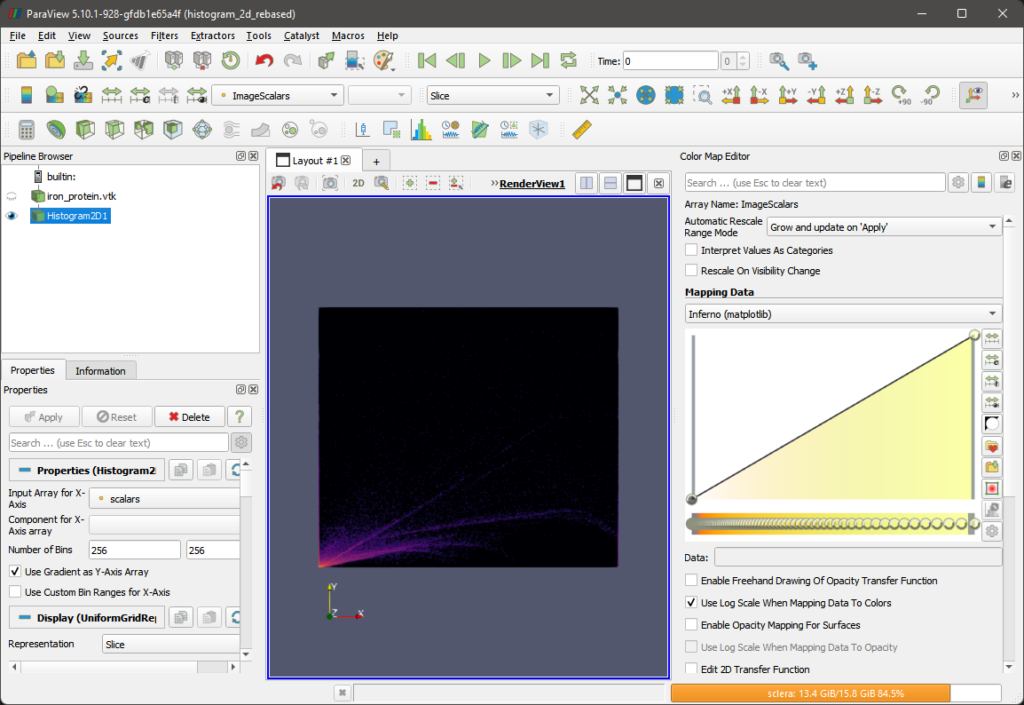
2D Histogram
To aid in the definition of 2D transfer functions, it is useful to compute a 2D histogram over the two different scalar fields of choice. This histogram helps highlight areas where interesting relationships between the two fields exist.
ParaView has a new algorithm called Histogram2D to compute 2D histograms for most types of vtkDataSets over two different data array components or their gradient magnitudes. The output of this filter is a one-component vtkImageData of type double that can be visualized in ParaView’s render view as an image slice.
Transfer Function Editor
When you enable the Use 2D transfer function checkbox, the color opacity editor switches to the 2D transfer function editor.
The editor displays the 2D histogram of the chosen scalar field with the number of bins defined by the Number of histogram bins property. Changing the number of bins, triggers an update to the histogram based on whether or not the Automatic histogram property is enabled.
The histogram is displayed as a grayscale image where white indicates the highest density and black indicates the lowest density. A legend on the right shows the density range. Hovering over a pixel/point in the histogram shows the data values for the histogrammed arrays as well as the density.
2D Transfer Function Editor UI
ParaView’s new 2D transfer function editor allows you to generate a 2D transfer function via rectangular regions of interest. The user can add as many of these regions as he/she likes to customize the transfer function. Each region is assigned a user-specifiable color and opacity which are distributed in the box area as a 2D Gaussian distribution. These regions can be dragged and resized over the 2D histogram to change the overall function.
Once the 2D transfer function editor is activated, a transfer function box can be added by double-clicking anywhere inside the bounds of the histogram. The box can then be moved by left-clicking, holding, and dragging the mouse cursor anywhere inside the bounds of the box. The box can be resized by holding and dragging any of the four corners of the box. The color and opacity of the box can be changed by activating the color chooser dialog using the new tool button provided on the right-hand side of the editor. A box can be deleted by clicking on it to select it and pressing the Delete key on the keyboard.
New Proxy and Representation Changes
To integrate 2D transfer functions in ParaView, the vtkImageVolumeRepresentation has been enhanced with new functions and corresponding properties:
- Enable 2D transfer functions –
SetUseTransfer2D - Enable the use of gradient magnitude of the scalar array as the Y-axis of the transfer function –
SetUseGradientForTransfer2D - Set the second color array and array component –
SetColorArrayandSetColorArray2Component - Set the 2D transfer function to use –
SetTransferFunction2D
The new properties are available in the Volume rendering section of the Properties panel. They are marked as advanced, so they are only visible when the advanced properties option is toggled on. Note that the widget for selecting the Y-axis array is only shown if the option to use gradient is disabled.
Each box in the 2D transfer function editor is represented by a new class vtkPVTransferFunction2DBox that exposes API for its bounds, color, and opacity. A vector of these boxes is managed by vtkPVTransferFunction2D, which provides utility API for adding, removing, and editing control boxes on the transfer function. The image data representing the 2D transfer function is composed of these boxes via the vtkPVTransferFunction2D::Build method.
A new proxy class called vtkSMTransferFunction2DProxy manages the server-side vtkPVTransferFunction2D object.
Future work
In this task, we have added support for 2D transfer functions in ParaView’s GPU-based raycaster volume rendering algorithms. To expand on this work in the future, the 2D transfer function editor added in this phase could potentially be improved in several ways:
- Add support for different opacity functions per box like a step function, ramp (with specified slope), etc.
- Add support for quantizing the boxes as tables like the current 1D transfer functions.
- Extend the transfer function editor to a true multivariate transfer function editor (with more than two scalar arrays) that can be displayed as a parallel coordinate histogram view in the color opacity editor.
Acknowledgments
The authors thank the Data Analysis and Assessment Center of the United States Department of Defense High Performance Computing Modernization Program for sponsoring the development of this ParaView feature.