CDash Now Supports CMake Build Instrumentation
Overview
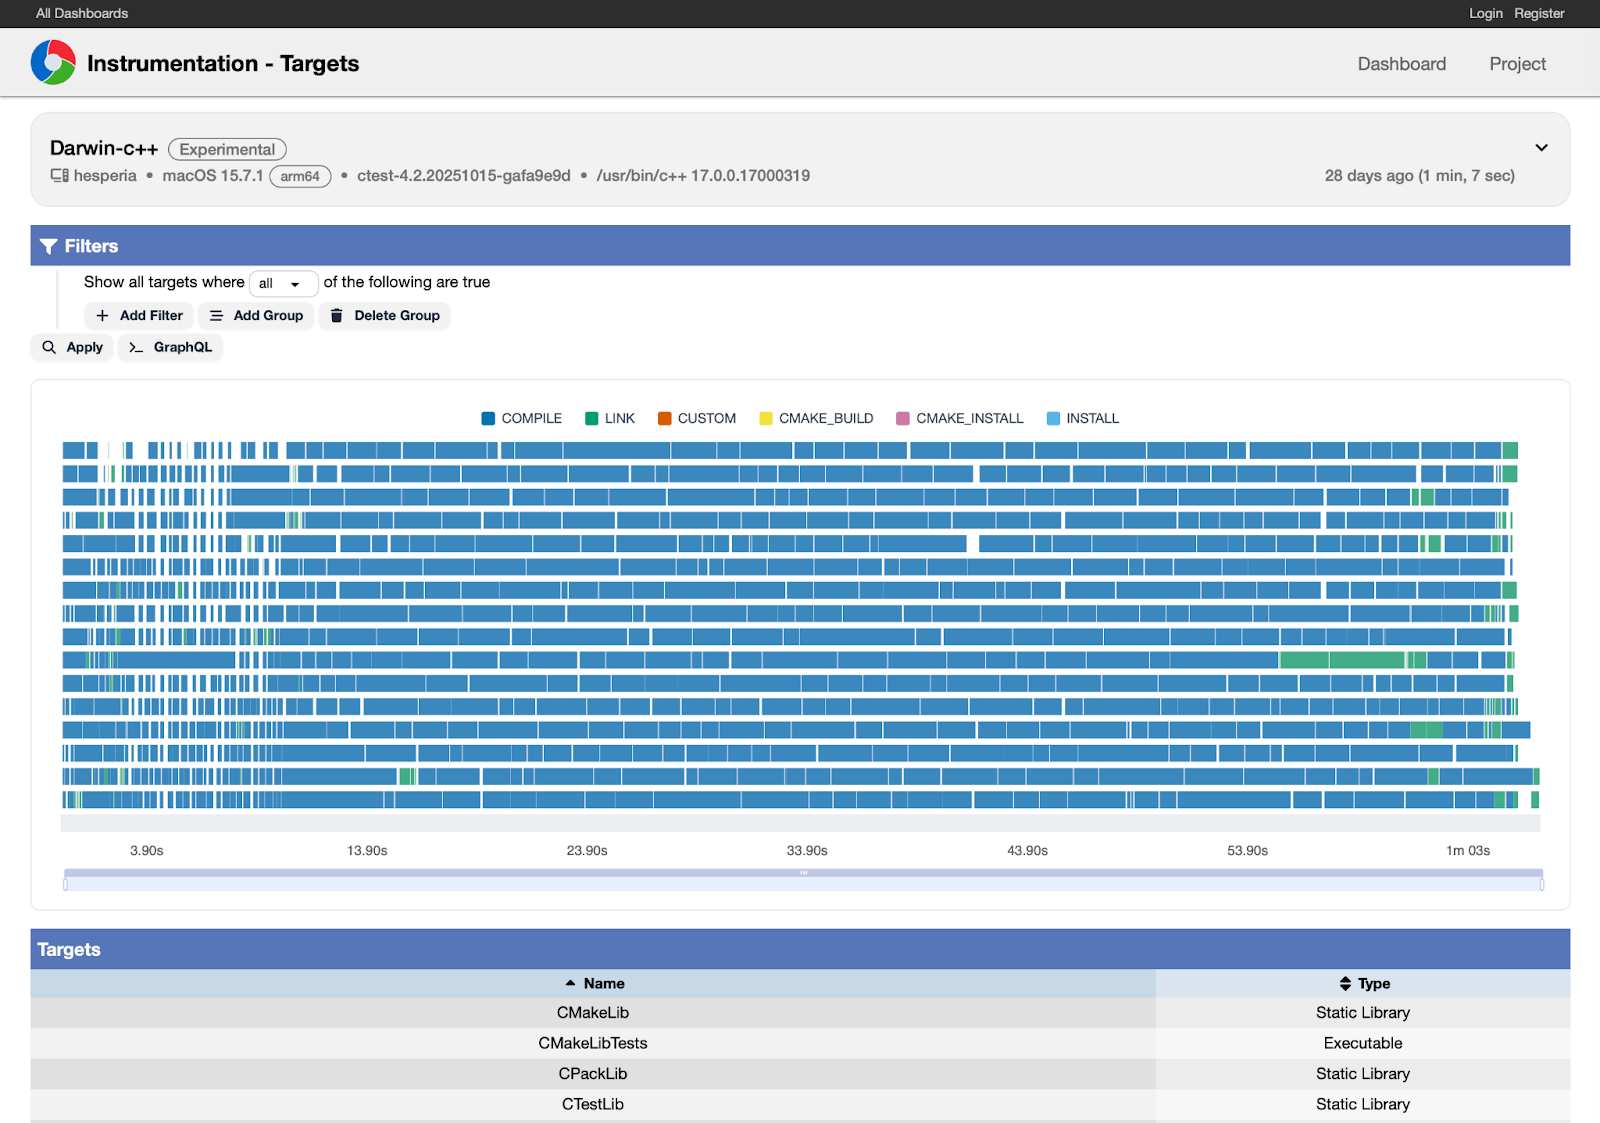
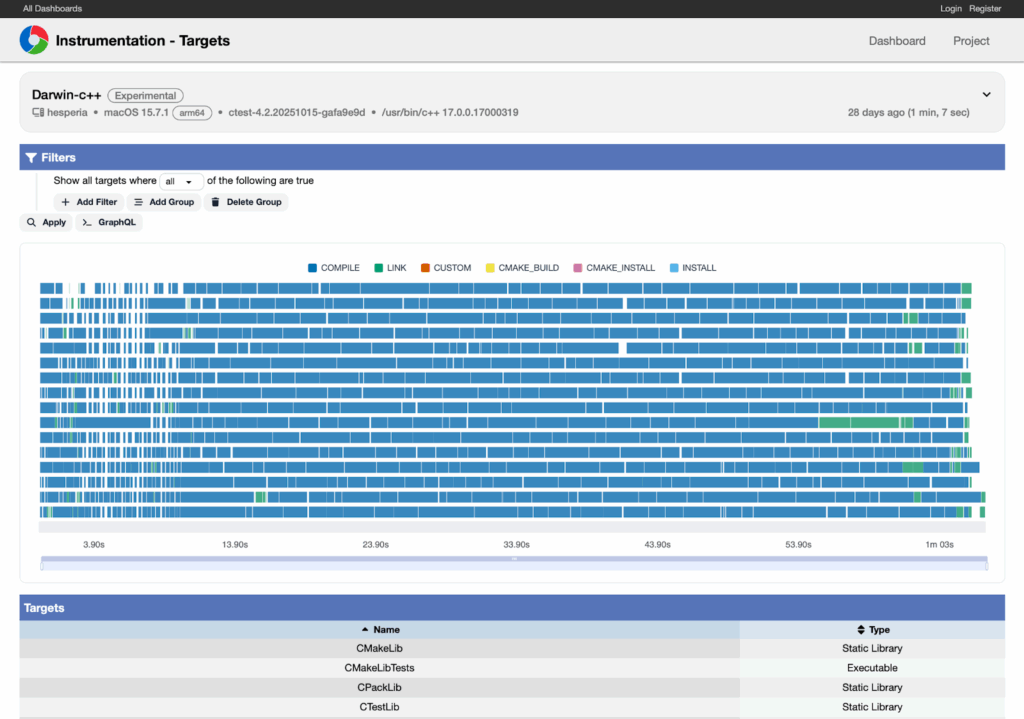
Is your project struggling with long build times? CDash can now help you identify bottlenecks, thanks to support for CMake’s experimental build instrumentation feature. Starting in version 4.6, CDash displays an interactive flame graph of build commands colored by command type if instrumentation data is submitted. The power of this feature is best demonstrated with an example.
Example
This example shows the result of a build of CMake itself with instrumentation enabled. Commands are colored by type, allowing users to quickly see the relative proportions of compile, link, and custom command times.
cmliblzma.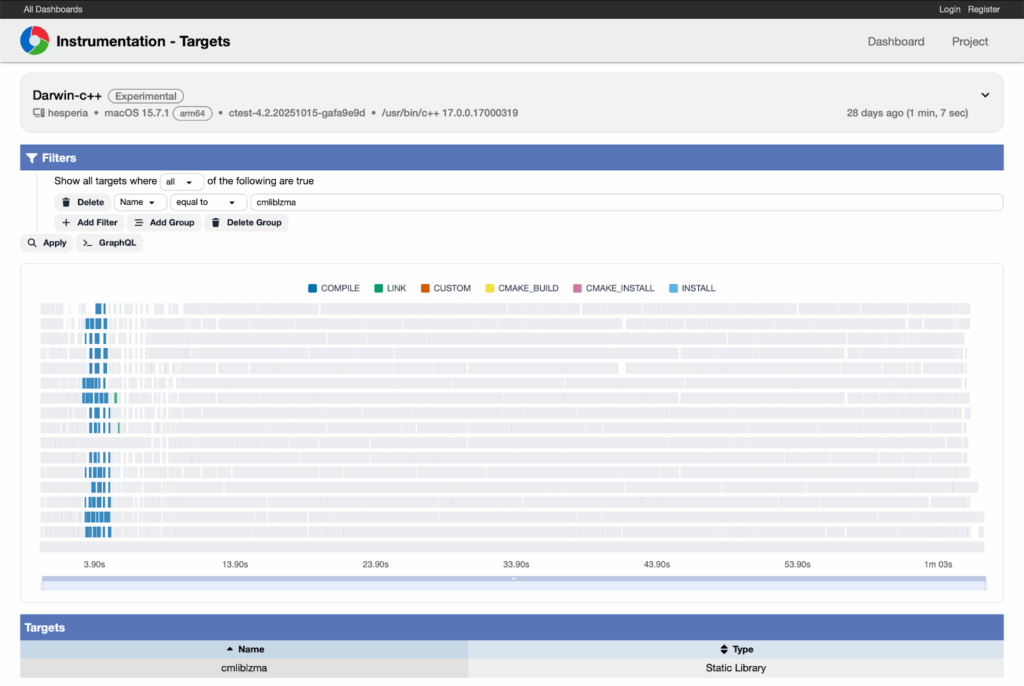
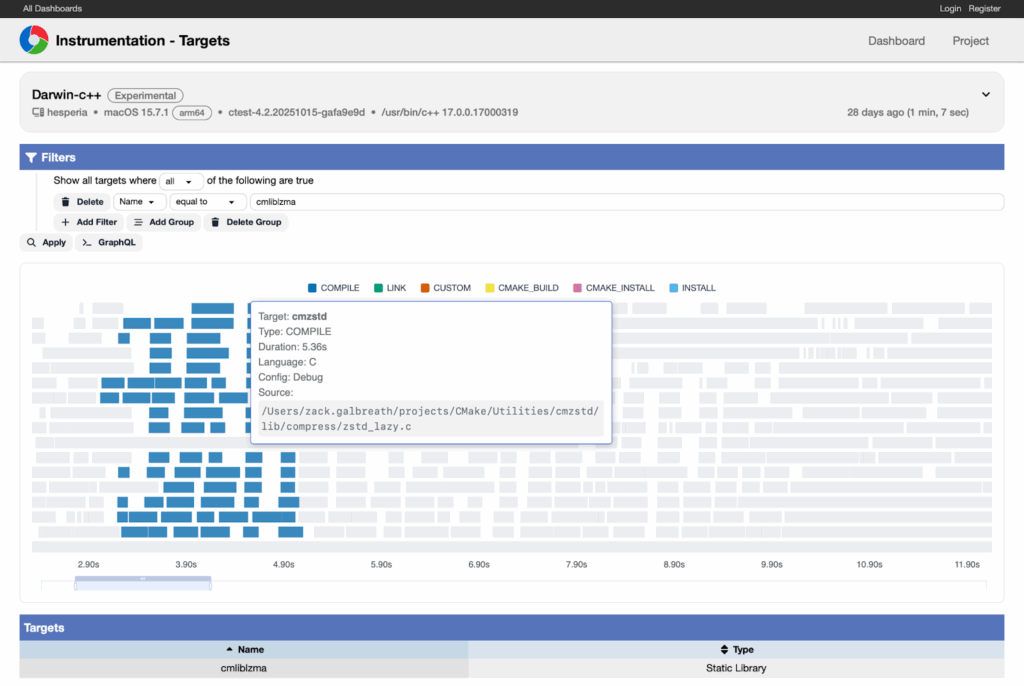
Zooming in, we can hover over a command to see that the long-running command overlapping with the build of cmliblzma is the build of cmzstd.
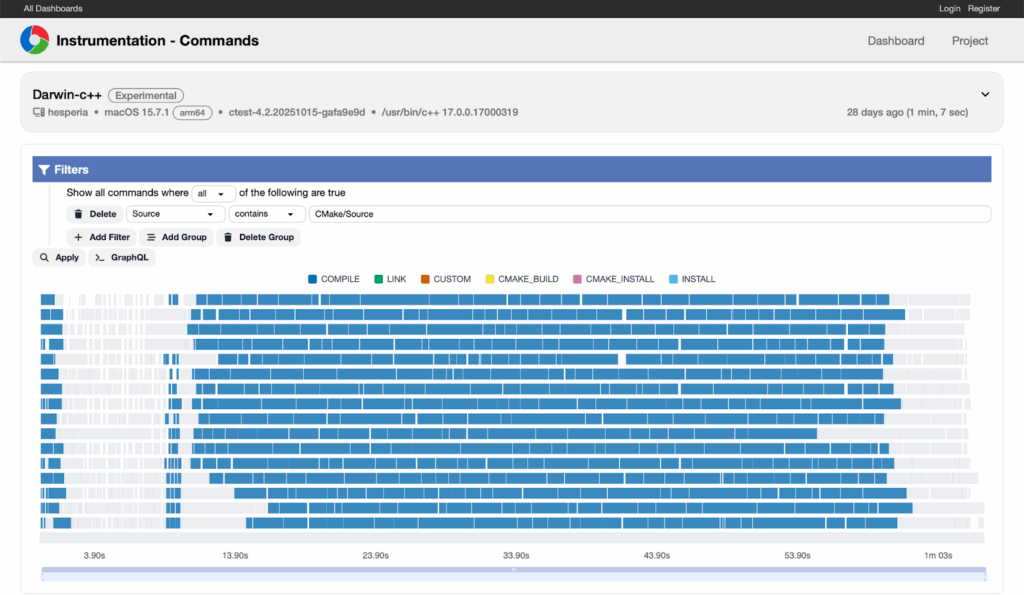
A similar page allows users to filter commands directly. For example, let’s look at when all commands related to files in the Source directory were run.
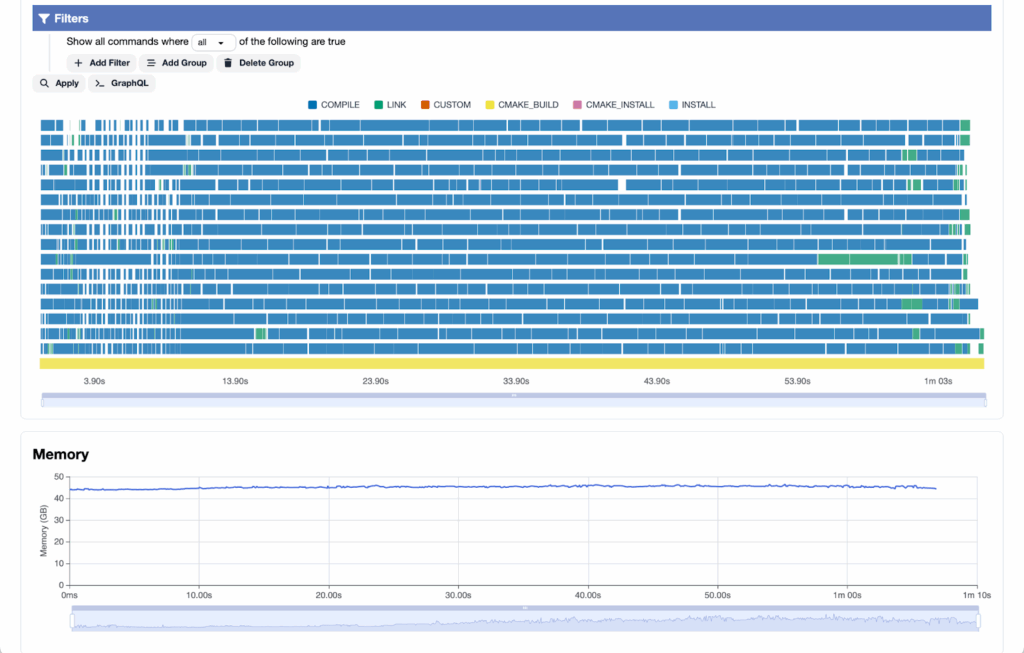
The same page also displays the memory alongside the flame graph, allowing users to correlate changes in available memory with individual commands.
Try It Yourself
The simplest way to enable instrumentation in your dashboard client builds is to two set two environment variables:
CTEST_USE_INSTRUMENTATION=1CTEST_EXPERIMENTAL_INSTRUMENTATION=<current UUID value>
Otherwise nothing else needs to change; you perform your build as normal. CTest provides the following options for reporting to CDash:
ctest -D Experimentalctest -T Start -T Configure -T Build -T Test -T Submitctest -S my_dashboard_script.cmake
After results are submitted, instrumentation pages can be reached via links from the build summary page.
