ClimatePipes: Hurricane Path Explorer using GeoJS

Back in October, we have introduced GeoJS, a library for web-enabled geospatial analysis and visualization, along with an overview of the feature API. Since then, we have been hard at work improving the core API, adding features, and writing documentation. Among the new features added includes: vector and polygon features, a simple per marker styling API, user interface widgets, and DOM independent mouse picking events. To show off all of these new features, we have put together several examples of how you can use GeoJS in your own application. Some of these examples are small samples intended to demonstrate a specific feature while others serve as a standalone application. One recent example we added is intended to show GeoJS used in conjunction with traditional infographic visualizations.
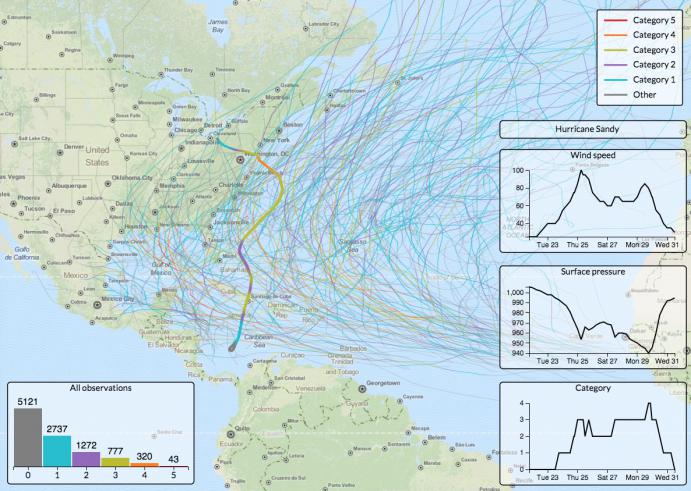
The hurricane path explorer shows all major hurricanes in the North Atlantic since 1980. We have created this example using a dataset provided by NOAA National Climate Data Center (NCDC). For the application usage purposes, we have filtered and converted the data into a JSON file. Inside this file, we have an array of objects, each representing a specific hurricane. Every hurricane has a name and arrrays associated with individual observations that give the location, time, and intensity of the storm. Using the line feature API, we have drawn a line for every hurricane colored by the intensity given for that observation. The legend that appears in the upper right corner of the map is created from a legend widget, which makes creating categorical legends effortless.
The feature mouse selection API provides events that the application can use to add interactivity to the map. In this case, the mouseover event is handled by the example to increase the width and opacity of the line. The handler also calls another method that uses the low level renderer interface to add custom widgets to the UI layer. This interface gives developers the flexibility to mix GeoJS seemlessly with a multitude of other web visualization technologies.
GeoJS is a high-performance visualization library targeted for GIS, GeoInformatics, and Climate data analysis and visualization. The source code is hosted on Github under Apache License V2 (https://github.com/OpenGeoscience/geojs).
The work is performed under DOE SBIR Phase II ( DE-SC0006493 ).

This is absolutely fantastic! Whenever I can show stuff to my in-laws I am happy; they’re going to love this.