DIVERS-GEN: Toward a Digital Twin for Water and Energy Systems
Water as a Critical Resource for Energy
Water is often overlooked as the hidden fuel for electricity generation. Hydropower (see Figure 1) relies directly on river flows, but fossil fuel and nuclear facilities also consume large volumes of water for cooling and operations. Shortages or warmer stream temperatures can restrict production, and these challenges are intensifying as demand rises.
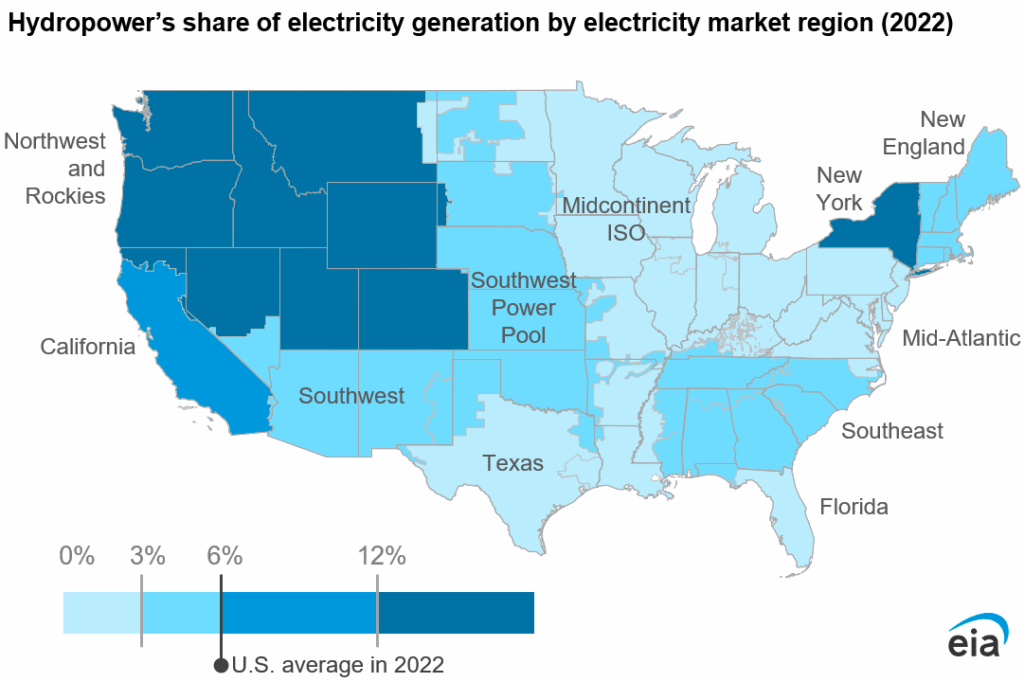
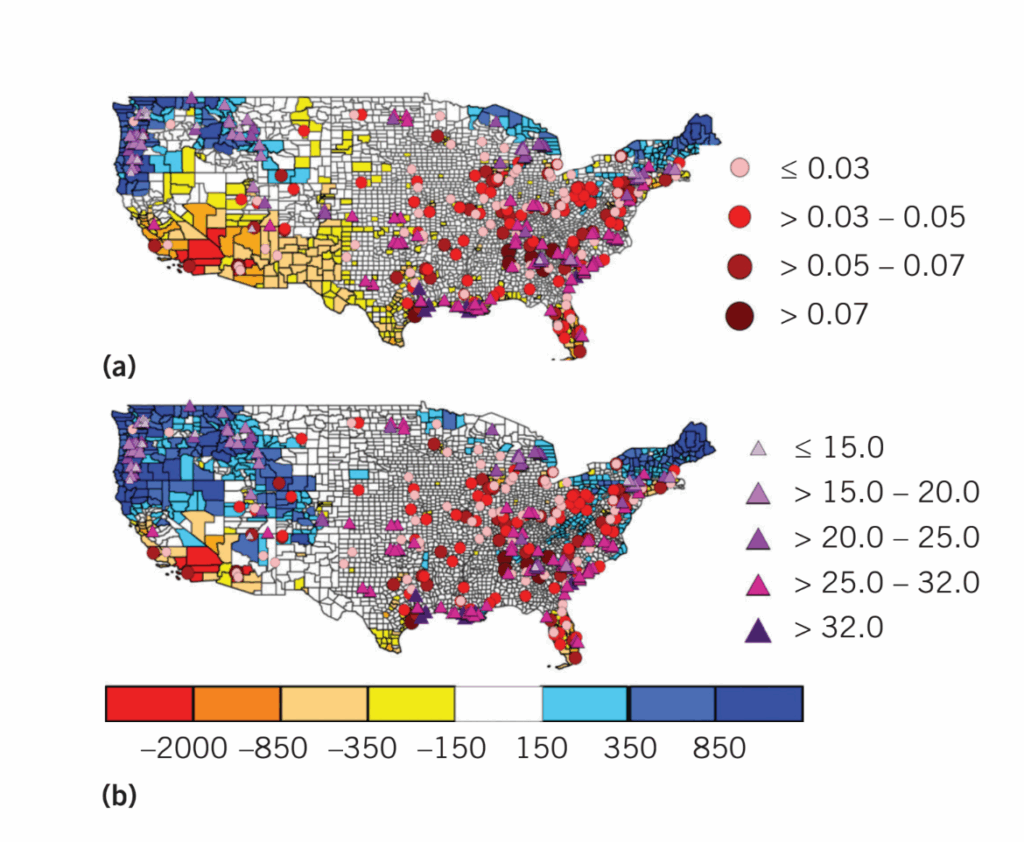
Figure 1 (Top). U.S. Hydropower share of electricity generation by electricity market region (source EIA). (Bottom) Spatial patterns of net water availability (1,000 Mgal/year) in the 2030s (2028 to 2032) for two plausible future conditions: (a) ensemble minimum and (b) ensemble median.
According to the U.S. Energy Information Administration’s Annual Energy Outlook 2023, total U.S. energy consumption, including electricity use and transmission losses, is projected to increase by up to 15% between 2022 and 2050. Much of this growth will be driven by industrial demand, transportation electrification, and the rapid expansion of data centers supporting AI and digital infrastructure. At the same time, shifts in hydrology, multi-sector water usage, and stricter environmental regulations are straining resources. Meeting future demand will require every major type of generation such as hydro, coal, gas, oil, and nuclear, to operate reliably, which in turn means water availability and temperature must be managed more carefully than ever before.
The Challenges Plant Operators Face
Power plants that depend on water are caught between growing demand and environmental limits. Plant operators must contend with hydrological uncertainty, competing usage from other sectors, and thermal limits that can force units offline during peak demand. Although federal agencies produce long-term environmental forecasts, these outputs are often too coarse to apply at the plant level. Meanwhile, existing hydrological tools such as HEC-RAS or SWMM are site-specific, difficult to scale, and require significant customization.
The result is a gap where operators lack an accessible system that bridges cutting-edge science with mid to long term decision-making.
The DIVERS-GEN Approach
To address this gap, Kitware and Northeastern University are jointly developing DIVERS-GEN (Data Integration and Visualization for Enhanced Resource Stewardship in Power GENeration). While initially targeted for hydropower, the methods and architecture extend naturally to all water-dependent facilities, including fossil fuel and nuclear plants.
DIVERS-GEN integrates three technical pillars:
- AI-driven downscaling. Machine learning models such as CNN-YNet and LSTM-based hydrology networks translate coarse Earth system outputs into high-resolution predictions of precipitation, evapotranspiration, discharge, and stream temperature.
- Unified data management. Built on Kitware’s open-source GeoInsight platform, the system ingests diverse formats such as GeoTIFF, NetCDF, GeoJSON, tabular, and transforms them into analysis-ready datasets accessible through web and Python APIs.
- Interactive decision support. A web-based system enables operators to ingest, browse, and visualize data; run predictive models in the cloud; and explore “what-if” scenarios with heatmaps, contour plots, and linked time-series graphs.
Demonstrating Feasibility
In this initial phase, we set out to demonstrate that the enabling technologies behind DIVERS-GEN could work together to form the foundation of a practical decision support system. Our focus was on the Tennessee Valley Authority (TVA) region, which provided a rich testbed of hydropower plants, reservoirs, and associated data sources. The TVA also exemplifies the challenges that many utilities face nationwide: diverse plant types, changing meteorological and hydrological inputs, and the need to balance energy production with environmental constraints.
Data System Development
A key milestone was the development of a data system capable of acquiring, ingesting, and managing diverse datasets. These included CMIP6 Earth system model outputs, USGS stream gauge data, county-level demographic projections, aerial imagery, and sub-basin shapefiles. To support this, we extended Kitware’s GeoInsight platform, which provides a microservices architecture with PostgreSQL/PostGIS for object relationships and metadata, MinIO for object storage, and Django-based APIs for data access.
Enhancements included:
- NetCDF integration. Multi-dimensional meteorological datasets stored as NetCDF were transformed into geospatial layers, enabling subsetting and visualization.
- Vector data extensions. Stream gauge vector features were linked to time-series tables, enabling long-term discharge and temperature plots.
- Bulk ingestion. JSON configuration-driven pipelines streamlined the import and indexing of multiple datasets at once.
- Preprocessing workflows. Using GeoPandas, XArray, and Pandas, incoming data was validated, re-projected, and stored in formats optimized for AI and visualization.
This infrastructure ensured that once new datasets were acquired, they could be harmonized and made immediately usable.
Water Availability Modeling
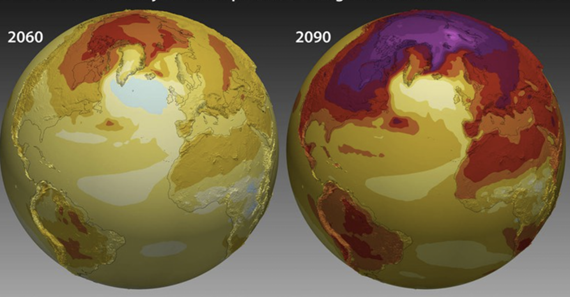
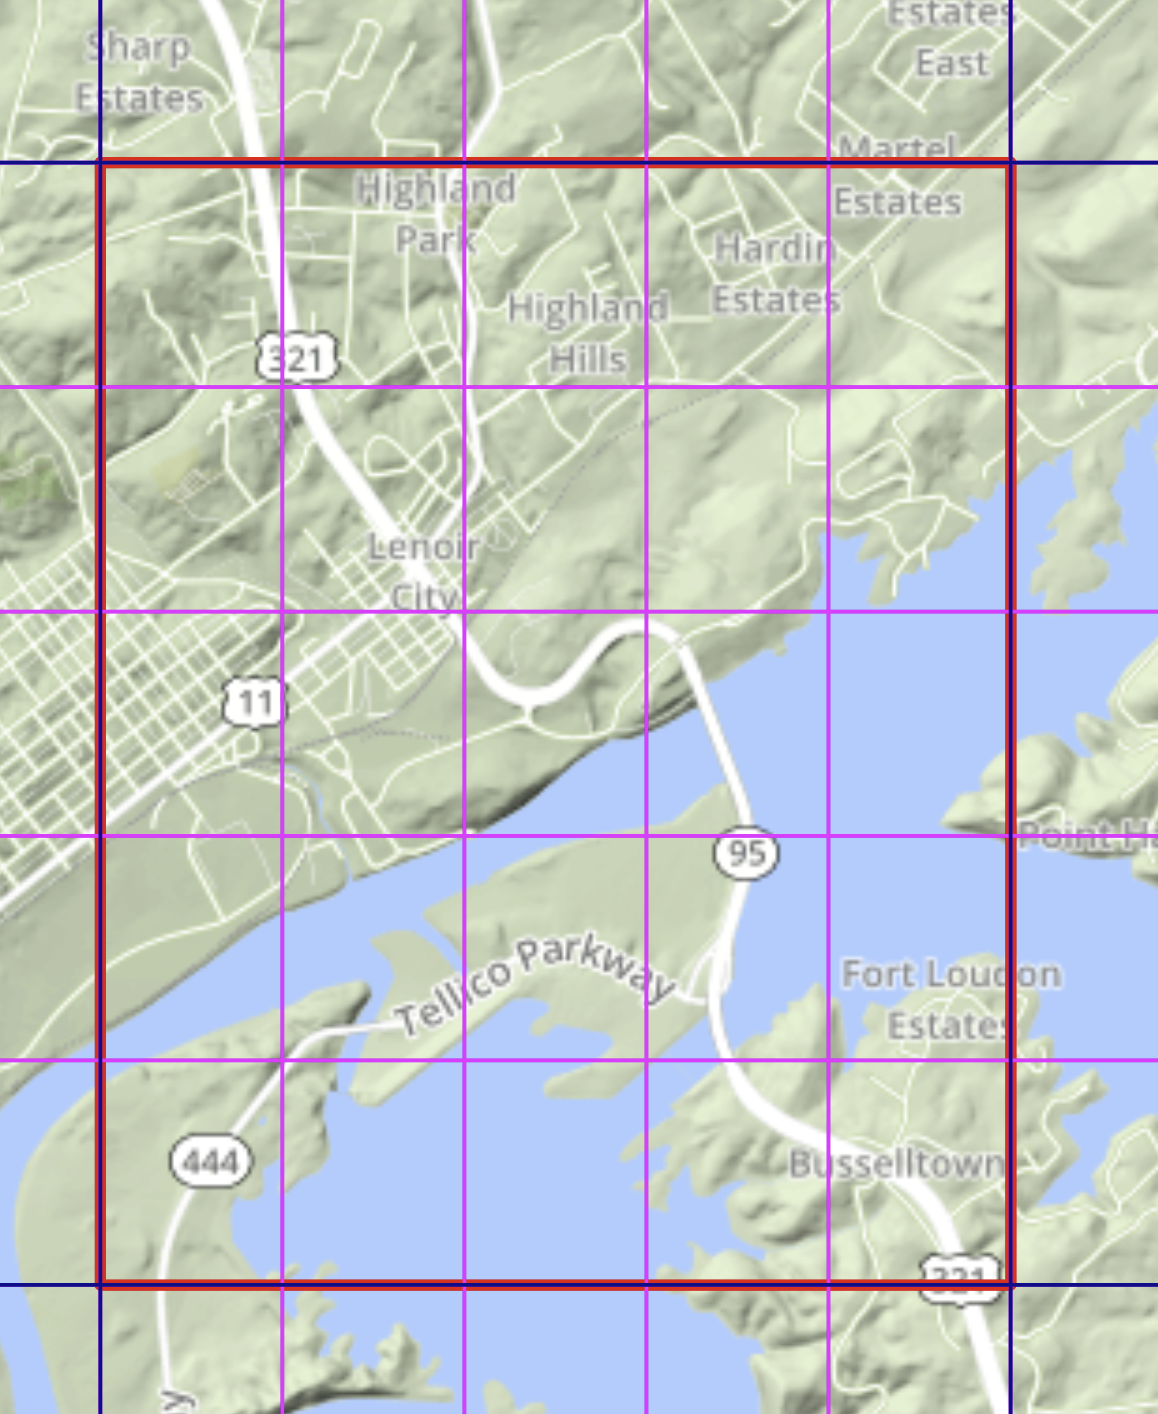
Figure 2. (top) Downscaling of earth system models [source: picture generated by DKRZ https://www.dkrz.de/de/kommunikation/klimasimulationen] (bottom) for water supply conditions at Fort Loudoun Dam in Lenoir City, TN. A 4km by 4km square encompassing the dam is shown in red.

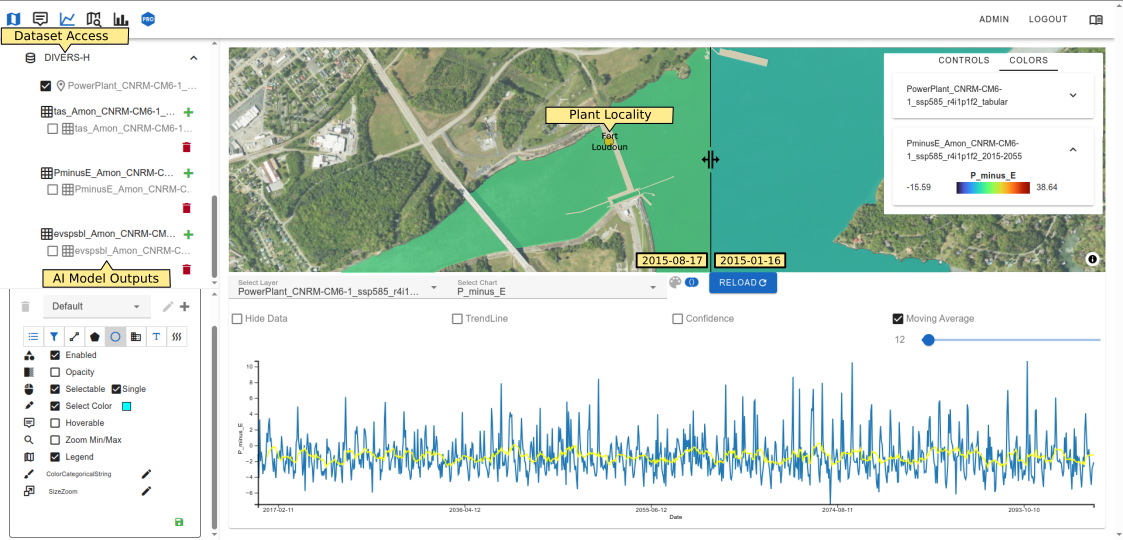
Figure 3: Results of water availability AI model at Fort Loudoun Dam. The upper-right panel is a splitscreen visualization of P minus E results inferred at two calendar dates six months apart. Below that is a time-series chart showing the monthly computed values (via AI downscaling) over a 50 year period (blue) and 12 month running average (yellow). The lower left panel has controls for setting style properties such as color model and opacity.
Predicting water availability was central to the feasibility study. Using precipitation minus evapotranspiration (P–E) as the key variable, we downscaled CMIP6 outputs from ~100 km resolution to ~2 km grids (see Figure 2). This required efficient interpolation and chunked processing of decades of climate data. The resulting projections provided localized estimates of water availability under multiple socio-economic scenarios and ensemble members.
At the TVA Fort Loudoun Dam, for example, the system generated 50-year P–E time series data, enabling comparison of ensemble minimum and median conditions (see Figure 3). This demonstrated how global Earth system models could be translated into actionable, site-level insights.
Discharge Modeling with Neural Hydrology
To complement P–E estimates, we tested integration with the open source NeuralHydrology package, which applies long short-term memory (LSTM) networks trained on the CAMELS-US dataset. We containerized these models and ran them against TVA basin data. With modest training, the LSTMs captured peak discharge events and closely tracked annual averages over 10-year test periods (see Figure 4). This integration proved that external AI codes can be wrapped and deployed seamlessly within the DIVERS-GEN workflow.
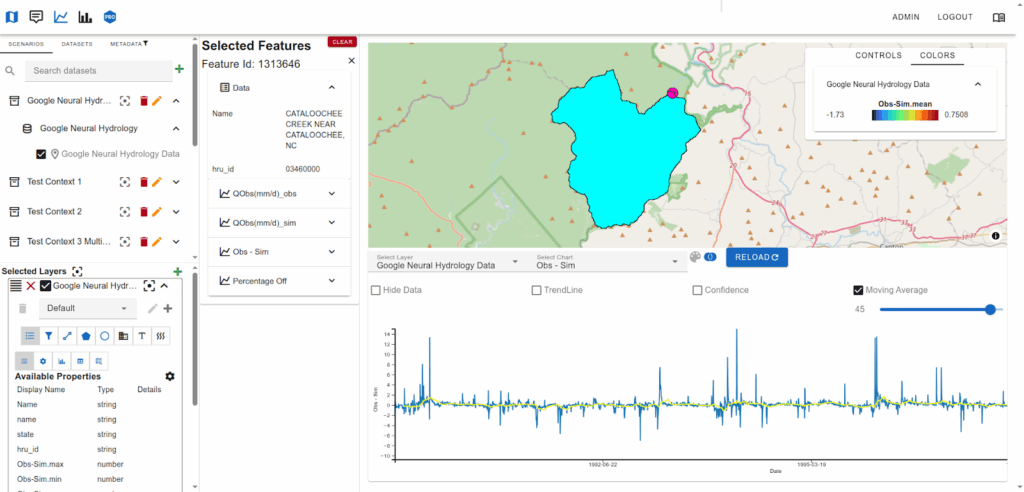
Figure 4. Screenshot of water discharge at one basin inside TVA, computed using Google Neural Hydrology model. The highlighted region (cyan) on the map is the selected basin, with the discharge point indicated by a red circle. The graph below the map shows the observed and predicted values over a 10 year time period. significance
Stream Temperature Prediction
Temperature is a critical operational factor, particularly for fossil fuel and nuclear facilities. We developed a pipeline combining USGS gauge data with downscaled CESM2 air temperature ensembles. Using four regression methods—linear, ridge, random forest, and support vector regression—we trained models on historical data (2005–2014) and projected stream temperatures through 2050 under multiple socio-economic scenarios.
The models achieved testing correlation coefficients above 0.9. Results were then ingested into the decision support system, where users could select a site and compare predictions across models and scenarios as shown in Figure 5.
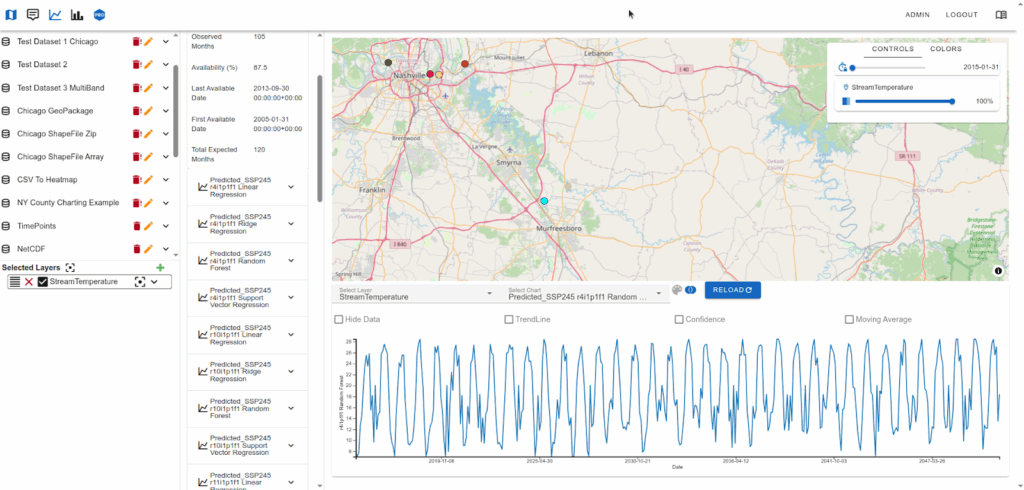
Figure 5. Screenshot showing one of the site stream temperature predictions modeled by AI. In all, 40 sites were modeled, each spanning 4 methods (linear regression, ridge regression, random forest, support vector regression), 3 scenarios (SSPs) and 3 ensemble indexes
Decision Support Prototype
The culmination of this work was a web-based decision support system developed with Django, Vue.js, and MapLibre GL JS. The interface supports:
- Interactive geospatial visualization with customizable styling of raster and vector layers.
- Linked time-series analysis, where selecting a feature on the map updates associated plots and vice versa.
- Scenario exploration, enabling users to overlay multiple runs and evaluate best- and worst-case conditions.
- Metadata tagging and search, simplifying discovery across large collections of datasets.
At a practical level, this means that a TVA operator could select a dam (Figure 6) and instantly visualize water availability, discharge, and stream temperature projections under different scenarios—all in a single, interactive environment.
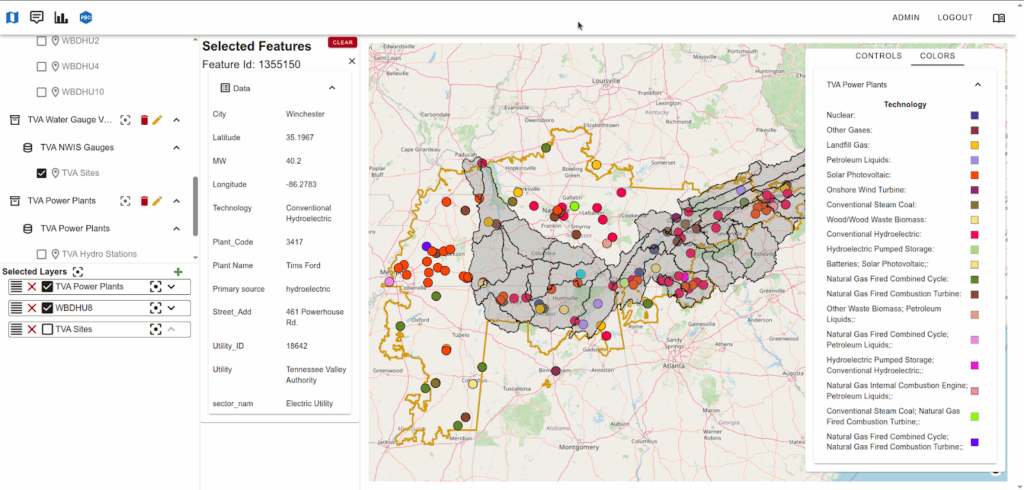
Figure 6. The prototype Decision Support System developed in Phase I includes a user interface with panels for selecting datasets to view, displaying data in tabular, graphic, and chart formats.
Why It Matters for Industry
For hydropower, DIVERS-GEN offers foresight into when reduced inflows may limit production. For fossil fuel and nuclear plants, it highlights when warmer cooling water could trigger operational or regulatory constraints. For regulators and planners, it provides a transparent, multi-scenario view into regional vulnerabilities.
By combining environmental forecasts, demographic trends, and AI predictions into one system, DIVERS-GEN reduces uncertainty and helps utilities move from reactive responses to proactive planning. The result is improved resilience, more efficient operations, and stronger long-term strategies for managing water-dependent energy generation.
Next Steps
With feasibility demonstrated, the project now shifts toward scaling and commercialization. The next stage will:
- Integrate AI models directly into the Decision Support System for on-demand predictions.
- Extend dataset coverage to additional regions and basins.
- Refine the user experience for both technical staff and decision-makers.
- Deliver industry demonstrations across diverse plant types.
Closing Thoughts
Water and energy are inseparable. As demand and hydrological pressures mount, the industry needs tools that connect environmental science with daily operations. DIVERS-GEN demonstrates that such a system is possible: integrating diverse data, AI models, and visualization into a decision support system designed for real-world utility needs.
The next stage will deliver DIVERS-GEN, equipping the power sector with the foresight to anticipate risks, optimize operations, and secure the nation’s energy future.
Collaborate With Us
At Kitware, we specialize in building AI-first geospatial applications that integrate large-scale data, visualization, and modeling for real-world decision-making. Our open-source platforms and custom solutions empower organizations in energy, environmental science, and national security to transform complex data into actionable intelligence.
If your organization is exploring digital twins, water–energy modeling, or AI-enabled geospatial analytics, we welcome the opportunity to collaborate.
Contact us at kitware.com/contact to learn how we can help design, prototype, and deploy solutions tailored to your operational and research needs.
About the Project Team
The DIVERS-GEN project was led by Aashish Chaudhary (product owner) and John Tourtellott (project manager) with Bryon Lewis and Anne Haley as senior engineers. Together, the team developed the DIVERS-GEN prototype and technical framework in partnership with Northeastern University’s Sustainability & Data Sciences Laboratory.