Dose-Volume Histogram Calculation in Radiotherapy Treatment Plans Using VTK

Radiotherapy is the use of ionizing radiation to treat cancer. Sophisticated software programs known as treatment planning systems (TPS) are commercially available to tailor-make treatment plans for individual patients. These systems mainly allow clinicians to predict the dose delivered to each voxel in the patient for a given orientation of the radiation beams and other parameters used before actually treating the patients. The best possible plan, which provides the highest therapeutic ratio (highest tumour control with least normal tissue complications), is selected for treatment. There are many tools available for evaluating rival plans in radiotherapy. The most widely used are the dose-volume histograms (DVH), which are ubiquitous in radiotherapy. Assimilating the vast amount of information in a 3D radiation dose array is very difficult. DVH condenses this vast information into easily interpretable 2D graphs. There are two types of DVHs commonly used, namely differential and cumulative DVHs. Differential DVH represents the percentage or absolute volume (depending on the mode of display) receiving dose in the corresponding dose bin, whereas the cumulative DVH represents the percentage or absolute volume receiving greater than or equal to the value in the corresponding dose bin. These DVHs are also used to calculate other radiobiological plan metrics such as tumour control probability (TCP) and normal tissue complication probability (NTCP), among others. Though DVH is widely-used in radiotherapy, there is neither a single method adopted nor the methods to derive them documented by the TPS vendors. This article briefly explains the method for calculating DVH using VTK.
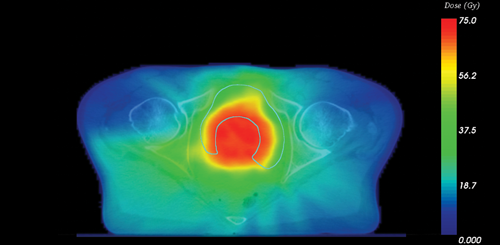
Figure 1: 3D Dose array shown on an axial slice with bladder contour
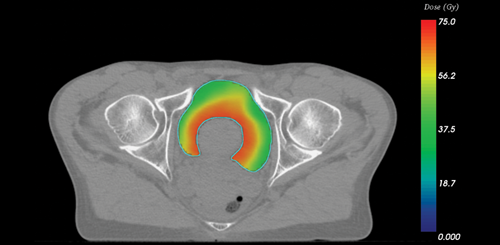
Figure 2: Dose extracted for a bladder shown on an axial slice with bladder contour
In radiotherapy planning, the 3D shape of the structures is generally derived from a set of 2D contours drawn on the CT image along the z-axis. A class “DCMImporter” has been developed to import RT structures and plans exported from TPS in DICOM format. A surface mesh of the structure is generated from the imported set of 2D contours using vtkMarchingCubes, and the resulting mesh is stored as vtkPolyData. The dose calculated within the patient volume by the TPS is a 3D array with a commonly used resolution of 2-to-3 mm. This 3D dose array is exported in DICOM format for the corresponding patient, and read in using vtkGDCMImageReader (which is available in gdcm built with VTK support); the output is stored as vtkImageData. The key step in calculating DVH is to identify the voxels inside the structure of interest. This can be achieved with a combination of some of the VTK classes, namely vtkPolyDataToImageStencil and vtkImageStencil. The dose outside the structure is set to zero using SetBackgroundValue in vtkImageStencil. The vtkImageAccumulate class can then be used to calculate maximum, minimum, mean dose, and standard deviation directly from the output of vtkImageStencil. The entire dose array and dose extracted for bladder using vtkPolyDataToImageStencil is shown on an axial slice in Figures 1 and 2 respectively. The code snippet for the DVH calculation is given below.
//Extract dose inside the structure
vtkSmartPointer<vtkPolyDataToImageStencil>
meshToStencil=
vtkSmartPointer<vtkPolyDataToImageStencil>::New();
meshToStencil->SetTolerance(0);
meshToStencil->SetInformationInput(doseGrid);
meshToStencil->
SetOutputSpacing(doseGrid->GetSpacing());
meshToStencil->
SetOutputOrigin(doseGrid->GetOrigin());
meshToStencil->SetInput (structure);
meshToStencil->Update();
//Convert image stencil to vtkImageData
vtkSmartPointer<vtkImageStencil>stencilToImage=
vtkSmartPointer<vtkImageStencil>::New();
stencilToImage->
SetStencil(meshToStencil->GetOutput());
stencilToImage->SetInput(doseGrid);
stencilToImage->ReverseStencilOff();
stencilToImage->SetBackgroundValue(0);
stencilToImage->Update();
vtkSmartPointer<vtkImageAccumulate>ia=
vtkSmartPointer<vtkImageAccumulate>::New();
ia->SetInputConnection
(stencilToImage->GetOutputPort());
ia->IgnoreZeroOn();
ia->Update();
long vc=ia->GetVoxelCount();//No. of voxels inside
double maxDose=ia->GetMax()[0];//1st comp. val
double minDose=ia->GetMin()[0];
double meanDose=ia->GetMean()[0];
double std=ia->GetStandardDeviation()[0];
The non-zero scalar values (voxels inside the structure) from the output of vtkImageStencil is used to make a frequency (number of voxels) histogram using a bin width of 0.02 Gy to reduce the size of the data values. Finally, one gets the volume receiving the dose in each dose bin. These differential DVHs are converted to cumulative DVHs, which are more commonly used in the clinic. Figure 3 shows a differential DVH for a tumour in a breast case. Cumulative DVHs are plotted using vtkCharts along with the DVHs calculated by commercially available TPS (Eclipse™ treatment planning system, Varian Medical Systems, Palo Alto, CA) for a breast and a prostate case in Figures 4 and 5 respectively. The vtkImageResample class can be used to resample the dose grid to a finer resolution to obtain more accurate results which will reduce the partial-volume effect.
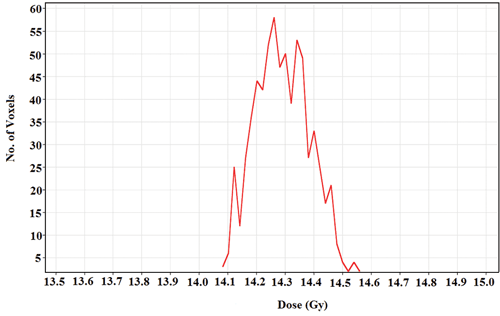
Figure 3: Differential DVH of a tumour bed for a breast case calculated using VTK.
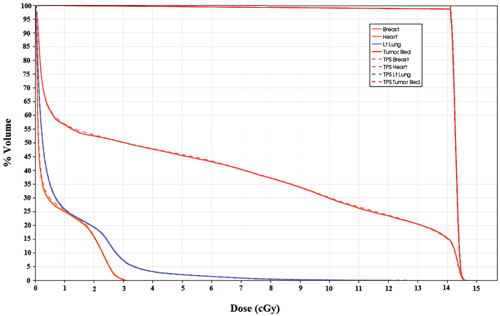
Figure 4: Comparison of a DVH calculated using VTK (solid) and TPS (dotted) for a breast case.
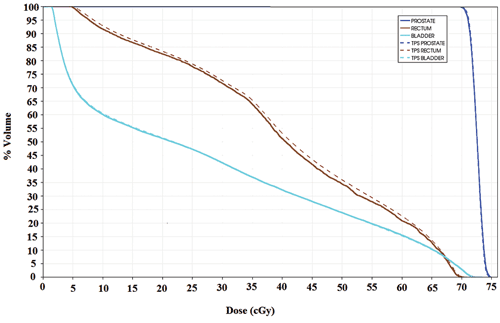
Figure 5: Comparison of a DVH calculated using VTK (solid) and TPS (dotted) for a prostate case.
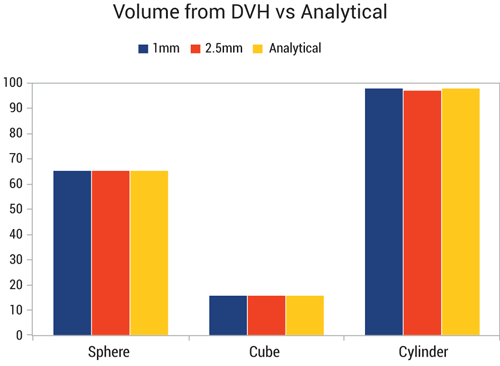
Figure 6: Volume comparison with calculated structures using VTK and analytical methods.
Conclusion
In summary, it is possible to calculate DVHs using VTK with reasonable accuracy and speed. The dose array can be resampled to finer resolutions if higher accuracy is needed.
 Jothybasu Selvaraj is a Ph.D. student in the Department of Medical Physics, Clatterbridge Cancer Centre, UK. His research interests include the effect of geometric uncertainties in radiotherapy, radiobiological modeling and image-guided radiotherapy. He is also passionate about visualization of radiotherapy datasets with VTK.
Once can also use the method described in this article to account for partial volume effect.
http://www.vtkjournal.org/browse/publication/792
Dear Jothybasu, interesting publication.
I am trying to calculate DVHs for my work using VTK but I have some difficulties creating dDVH and cDVH from the imageaccumulated filter. I am new user to the library I would appreciate some insight in the implementation of the DVHs.
Best regards,
Konstantinos.
You can contact me on Jothybasu@gmail.com
what is vtk