GeoNotebook: The Architecture

Chris Kotfila, Aashish Chaudhary, Petr Votava, Doruk Ozturk, Andrew Michaelis
In the first blog post about GeoNotebook, we discussed the needs of GIS data scientists and our approach to solving those needs. This post will delve deeper into the architecture behind GeoNotebook and how it differs from other online python execution engines for analyzing GIS data.
As noted in the first post, GeoNotebook uses Jupyter Notebook and Jupyter Hub to execute python commands from the web browser in order to manipulate and perform analysis on large geospatial datasets. The Notebook cells on the client side communicate with a Tornado Web Server, which in turn passes those commands to our custom GeoNotebook kernel, creating a bridge between notebook cells and the python execution environment.
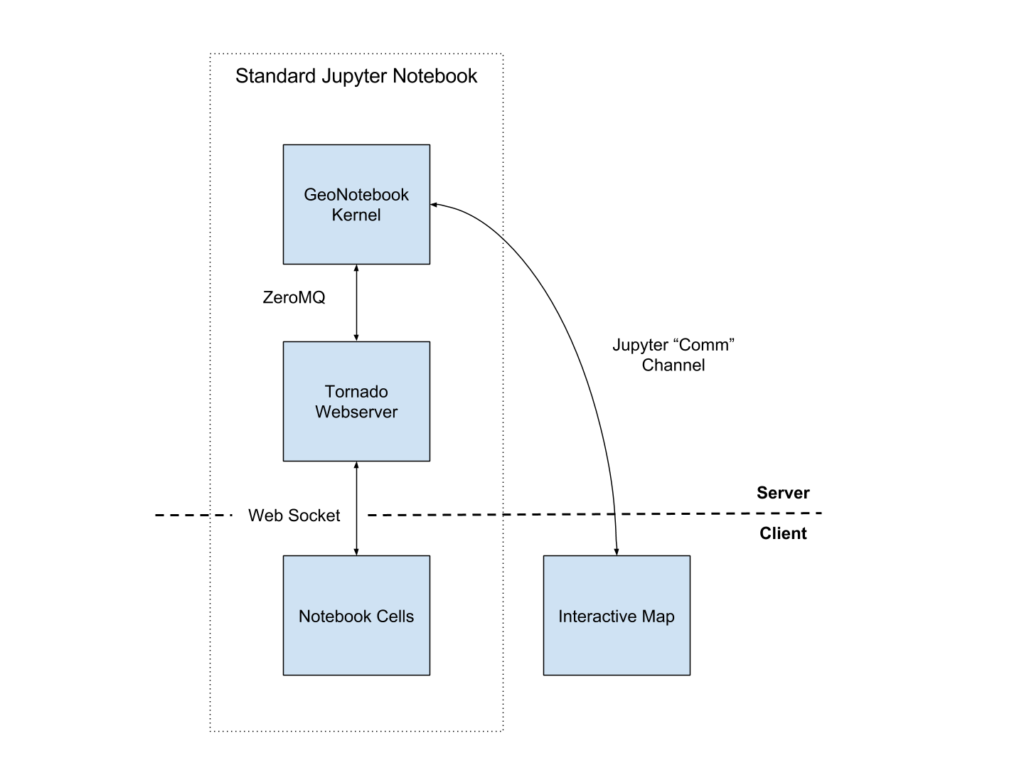
Jupyter Notebook provides an abstraction over this Cell -> Webserver -> Kernel bridge called a Comm channel. GeoNotebook makes liberal use of this Comm channel, using custom remote procedure calls to coordinate data access and analysis with data visualisation.
While GeoNotebook isn’t the only open source tool using Jupyter and other web-based analysis environments for visualizing interactive geospatial data on a map, other tools don’t fully address the workflow needs of data science geospatial visualization. Jupyter provides the environment to execute python commands for analysis, but it can’t, by default, perform tasks such as map reprojection or rendering map data to the browser. In particular, it provides no means of caching and serving image tiles.
Image tiles, which are generated by a tile server, are used to render large map images. These tiles allow large amounts of data to be rendered quickly in the browser. Various resolutions of the data are styled and dynamically loaded, to provide responsive scrolling and zooming. Traditional web-based map data, such as Google Maps, is relatively static; the same tiles are used over and over by many concurrent users, and are cached for quick retrieval when any user needs to view that area of the map.
Map tiles being rendered
Geospatial analysis, in contrast, rarely reuses the same tiles – each time the user interacts with the data, the map changes. When a python command is executed, such as re-centering the map or selecting an area for analysis, the map needs to be redrawn in order to reflect the change. A tile server must be installed for these new tiles to be generated; this requirement adds overhead for setup and maintenance, and complexity that requires a deep understanding of a wide array of geospatial technologies.
Our aim with GeoNotebook was to create a single, easily installed tool that can be easily set up and used by data scientists. We designed it to be a self-contained package that includes a built-in tile server and all of the services required to load and render data. Because of the complexity of several of the system libraries needed to style and render tiles, we have included a docker container for easy use. To get it up and running:
Checkout the code:
> git clone git@github.com:OpenGeoscience/geonotebook.git
Build the container:
> docker build -t geonotebook .
And run the notebook:
> docker run -p 8888:8888 -v /path/to/your/notebooks:/notebooks -it --rm geonotebook
GeoNotebook expands upon the basic Jupyter Notebook architecture of Notebook Cells, Tornado Webserver, and python kernel by adding a GeoNotebook Kernel, a Jupyter server extension for tile rendering and an interactive client-side map. That means once it is installed, you can dive in using data from your own computer.
GeoNotebook Architecture
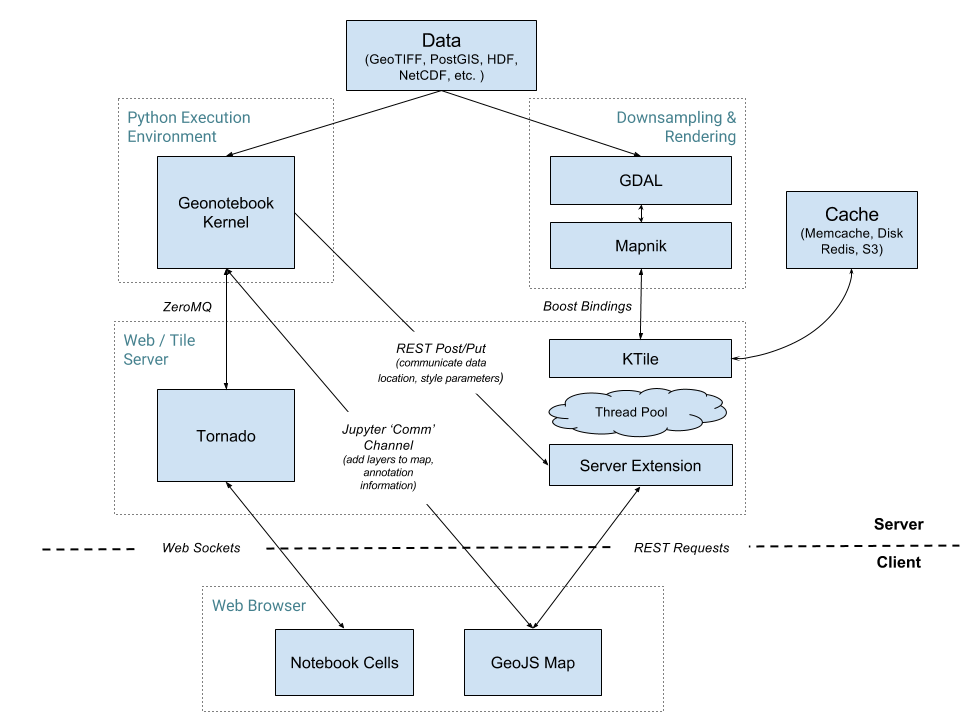
GeoNotebook Architecture Diagram
On the client side, a GeoJS map joins the notebook cells in the browser, displaying the GIS data side by side with the Notebook cells. The GeoNotebook kernel injects a custom object into the python execution environment that provides a Python API for interacting with the map (e.g. adding and removing layers). Additionally, because the GeoJS map can talk back to the GeoNotebook Kernel, you can also interact with the map and have it affect the python (e.g. subsetting data with map annotations). For example, if you manually annotate an area on the map, that annotation will be reflected in the Notebook cells.
This two-way communication works via a set of custom remote procedure calls, managed by the Comm channel. The Comm channel abstraction is key to a whole bunch of exciting new functionality.
For more details, check out the GeoNotebook readthedocs, or email us at kitware@kitware.com to learn more about using GeoNotebook for your geospatial data.
Chris Kotfila will be presenting GeoNotebook at the upcoming JupyterCon and FOSS4G conferences. Both will put videos online after the conference, so keep an eye out for those tutorials soon!
Acknowledgement