Girder Worker and the COVALIC Grand Challenge

This is a continuation of our series of posts about Resonant, a data analytics and visualization platform for the web.
Posts in this series:
Understanding the Resonant Platform
Girder Applications: An Inside Look
Girder Worker and the COVALIC Grand Challenge
Geospatial Visualization with GeoJS
Resonant Visualization with Candela
Recapping Resonant
Girder Worker is a distributed processing tool built on top of celery, a Python based distributed task queue, that integrates with Gider data IO and job management. By virtue of using celery, processing of data stored in Girder can be scaled independently of the Girder server itself. New machines can be added to the pool of workers to increase the number of processing tasks that can occur in parallel. Girder Worker supports multiple execution modes for different sorts of general purpose tasks. Tasks can be written in Python, R, pyspark, Julia, Swift, or even Docker containers.
This post will focus on the COVALIC project, funded by the NIH, which used both Girder & Girder Worker to create infrastructure for hosting and administering grand challenges in the web, with a particular focus on medical imaging challenges.
The Grand Challenge
There are two main roles associated with a grand challenge: administrators and participants.
The administrators: this is typically a set of institutions or individuals who are stakeholders in the outcome of the challenge. They present the challenge to their target audience of participants to solicit submissions of candidate solutions to the problem. They have an interest in advancing the state of the art in the domain of the challenge problem.
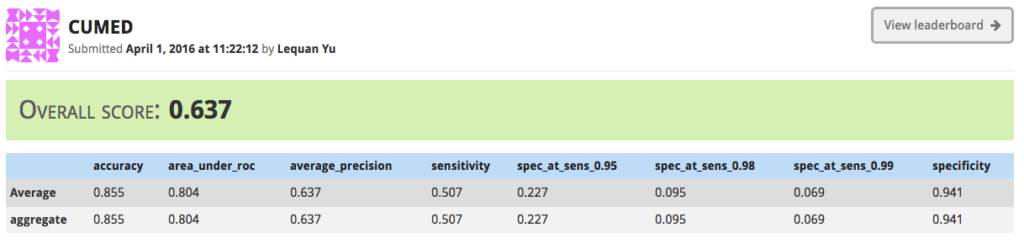
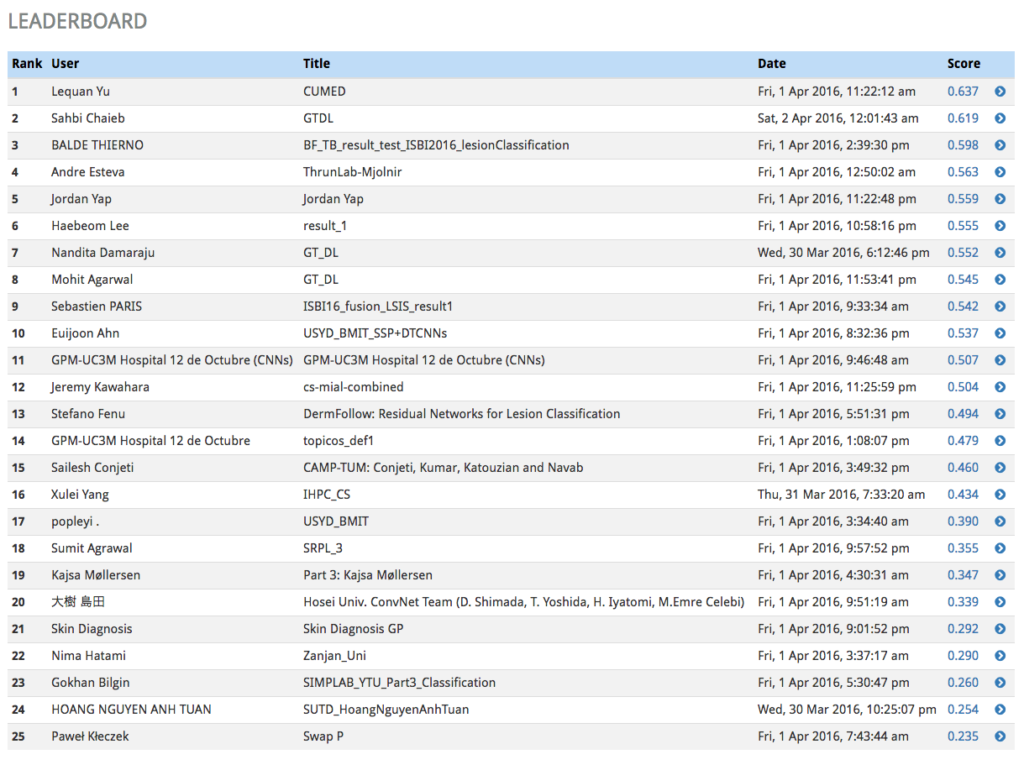
The participants: this is the set of institutions or individuals who submit candidate solutions to the challenge as a way of demonstrating the efficacy of their novel algorithms in the problem domain. Their submissions are scored based on metrics decided upon by the challenge administrators to be reasonable quantitative evaluations of the fitness of the algorithm, and the combined score is used to rank each submission in a leaderboard.
It’s common for challenges to be divided into multiple phases. Each phase has two special datasets associated with it:
- The input dataset, which is a set of files such as 2D or 3D images on which participants should run their processing algorithm. These files are meant to span a variety of real-world cases in the challenge domain to ensure that the algorithms being developed work across as many real world cases as possible. We do not require any specific structure, format, or type for this dataset, it’s simply a set of files.
- The ground truth dataset, which represents the ideal target results of the processing. The closer the submitted results are to the ground truth dataset, the higher the submitter’s score will be. The definition of “close” and the implementation of computing that similarity is defined on a per-challenge basis.
Often, a challenge will have an initial “training” phase in which the ground truth data is available to participants to give them more insight into how their algorithm should perform, and a second “testing” phase which is competitive, and in which the ground truth is not available for participants to view. Optionally, challenge administrators may disable even showing participants their scored results until the challenge is over so that participants can’t attempt to game the system by tuning their algorithm to maximize their score. In such a setup, it’s critical that the datasets of the two different phases are disjoint.
With our partners at the Memorial Sloan Kettering Cancer Center, Kitware administered a set of grand challenges via our public-facing challenge hosting server at https://challenge.kitware.com. This challenge was open to participants at the International Symposium on Biomedical Imaging (ISBI) conference in 2016. The challenge was composed of three individual sub-challenges in the field of dermoscopy.
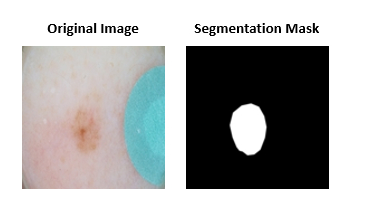
The first sub-challenge asked participants to segment lesions from 2D color photographs of patients’ skin.
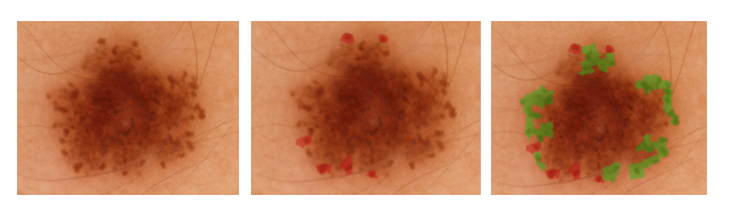
The second sub-challenge required algorithms to automatically annotate clinically significant features in dermoscopic images along with provided lesion segmentation masks.
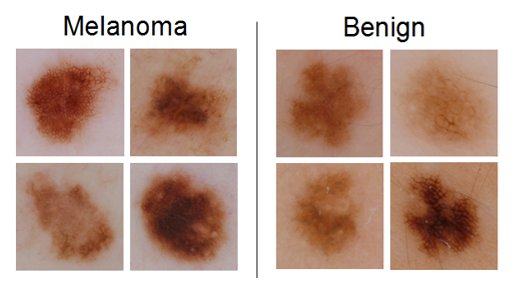
The third sub-challenge involved automatically classifying color images containing lesions as either malignant or benign (the “holy grail” of dermoscopy).
During the conference week, 321 participants registered in the system, and 313 total submissions were made across all three challenges.
The Technology
The COVALIC application is a Girder application, a plugin to the Girder data management system with its own custom front-end user interface. Due to its need for computationally intensive processing of user-submitted data, the COVALIC stack also uses the Girder Worker.
The public-facing challenge site is hosted on Amazon Web Services, with the Girder server and the worker nodes deployed on EC2 instances, and using an S3 bucket as the backing assetstore for all the data managed by Girder. This stack is deployed across multiple machines using automated Ansible provisioning scripts divided into multiple roles for flexible scaling.
![]()
![]()
![]()
The use of Girder Worker affords a great deal of flexibility in the sorts of challenges we can host in the system. The worker nodes are provisioned with the docker engine and make use of the worker’s docker execution mode to run the scoring algorithms on user-submitted data. This execution mode provides a valuable abstraction of the data IO itself, such that supporting a new scoring algorithm becomes extremely simple for challenge administrators: all they have to do is construct a docker image that exposes an entry point (a command-line interface) that accepts a path to submission data, and the path to the ground truth data, runs the scoring on it, and writes the scores in a standard JSON format to standard output. The Girder Worker takes care of fetching the data, instantiating the docker container, mapping the data volume into the docker container, invoking the user’s command line executable using the path where the datasets are exposed in the container, reading the output from the task, and sending those results back to Girder in a secure manner. Since docker containers are entire machine images, there’s no need to worry about the environment it’s being deployed on, or what technology stack the scoring requires, and by using containers rather than hypervisor-based virtual machines, the images are much lighter and run much faster.
Girder Worker also provides local caching of fetched data. These caches have a high hit rate in the case of grand challenges, since the ground truth datasets are required every single time a submission is scored. By using its cache, the worker is able to avoid re-downloading ground truth data on most submissions.
To learn more about distributed data processing and Grand Challenge hosting, comment below or email kitware@kitware.com.
Stay tuned for the next installment in this series on Geospatial Visualizations.