Histogram-based Thresholding

This contribution includes classes for threshold estimation using the following methods: Huang[1], Intermodes and Minimum[8], IsoData[9], Li[5, 6], MaxEntropy[2], KittlerIllingworth[3], Moments[11], Yen[12], RenyiEntropy[2], Shanbhag[10], and Triangle[13].
All classes are largely derived from the AutoThresh [4] package for ImageJ. Parts of the brief outline below are taken from the presentation associated with the HistThresh[7] Matlab toolbox, which was also a source of information for the AutoThresh package. The exception is the triangle method, which was written before discovery of the AutoThresh package.
These classes have been included in ITK 4.0 and are implemented using the histogram framework.
Thresholding Algorithms
2.1 Huang
itkHuangThresholdImageFilter implements Huang’s fuzzy thresholding using Shannon’s entropy function[1]. The measure of fuzziness represents the difference between the original image and its binary version.
For a given threshold level, the fuzzy membership function for a pixel is defined by the absolute difference between the pixel gray level and the average gray level of the region to which it belongs, with a larger difference leading to a smaller membership value. The optimal threshold is the value that minimizes the fuzziness, as defined by Shannon’s entropy function, applied to the fuzzy membership functions.
2.2 Intermodes
itkIntermodesThresholdImageFilter implements the methods described in [8]. The histogram is iteratively smoothed until only two peaks remain. In one variant, the threshold is the midpoint of the two peaks, while in the other it is the minimum point between the peaks. The two variants are selected using the UseIntermodeOff method. This is not good for histograms with very unequal peaks.
2.3 IsoData
itkIsoDataThresholdImageFilter implements Ridler and Calvard’s [9] isodata method. It computes the average of voxels below and above the initial threshold. Threshold is set to the average of the two. Repeat until the threshold is larger than the average of the brightness of the two regions.
2.4 Li
itkLiThresholdImageFilter implements Li’s minimum cross entropy method[5, 6], which selects a threshold that minimizes the cross entropy between original and thresholded images.
2.5 MaxEntropy
itkMaxEntropyThresholdImageFilter implements the method described in [2], which chooses a threshold such that the entropies of distributions above and below threshold are maximized. This is one of several entropy-based approaches.
2.6 RenyiEntropy
itkRenyiEntropyThresholdImageFilter is similar to MaxEntropy, but uses a different entropy measure [2].
2.7 KittlerIllingworth
itkKittlerIllingworthThresholdImageFilter implements the minimum error thresholding method [3]. A threshold is selected that minimizes the number of misclassifications between the two normal distributions with the given means, variances, and proportions. This method assumes a Gaussian mixture model, similar to the Otsu method.
2.8 Moments
itkMomentsThresholdImageFilter implements Tsai’s moment preserving approach [11], which chooses a threshold such that the binary image has the same first three moments as the grey level image.
2.9 Yen
itkYenThresholdImageFilter implements thresholding based on a maximum correlation criterion [12] as a more computationally efficient alternative to entropy measures.
2.10 Shanbhag
itkShanbhagThresholdImageFilter implements Shanbhag’s extenstion of the Kapur method [10], which includes a distance from the threshold in the entropy measure.
2.11 Triangle
itkTriangleThresholdImageFilter implements a variant of [13]. The triangle method constructs a line between the histogram peak and the farthest end of the histogram. The threshold is the point of maximum distance between the line and the histogram. This implementation uses robust (default is 1% and 99%) estimation of histogram ends.
Results
The BrainProtonDensitySlice image, cropped and smoothed, is used to demonstrate the results. Smoothing has been applied to avoid gaps in the histogram and cropping has been applied to remove a peak at 0 that was caused by padding in the original. This is a slightly challenging image to threshold as there are three classes, but the two brighter ones overlap. The mode-based approaches result in Figure 2; select thresholds between the darkest (background) class and the foreground, thus merging the two foreground classes. Some of the entropy measures, shown in Figure 3, attempt to split the two foreground classes with varying degrees of success. The thresholds are shown on the histogram in Figure 4.
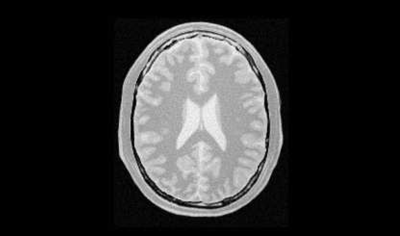
Figure 1: The input image.
Usage
These classes can be used in a similar way to the well-established OtsuThresholdImageFilter. Classes are templated over input and output image types and have methods to set the output inside and outside pixel values, the number of histogram bins, SetNumberOfHistogramBins. Intermodes have a method to select the intermodes or minimum selection option, SetUseIntermodes, and the maximum number of smoothing iterations – SetMaximumSmoothingIterations. All thresholding classes have an associated calculator class that operates on the histogram to estimate the threshold.
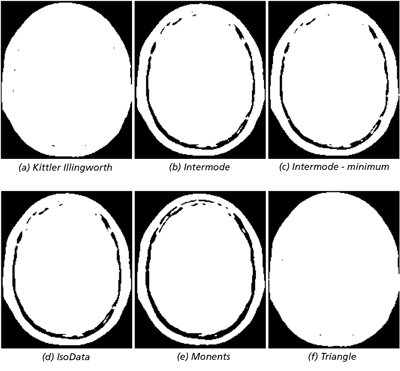
Figure 2: Thresholded images.
Comments, Conclusions & Further Work
Histogram-based approaches to estimating thresholds are very useful, but also can be surprisingly sensitive to changes in image characteristics. Padding images, for example, can easily add a large spike to a histogram that can cause unexpected outputs from many methods. In the example illustrated here, changing the framing of the scene could easily change the significance of the background class, leading to very different behavior. Underlying assumptions built into some methods, such as Gaussian mixture models, can become unrealistic if image acquisition conditions (e.g. lighting) change, and such changes are not necessarily obvious to the naked eye. Always use them with care and always attempt to constrain the areas to which such estimation is applied in order to minimize the chances of changes in image characteristics affecting application performance.
This contribution is a set of standard thresholding methods available in other packages. The implementation is derived from the ImageJ Java plugin. These classes have been included recently in the ITK 4 distribution via Gerrit and include a variety of tests.
Several of the articles cited describe extensions to the basic methods to support multi-level thresholding. Additional control of the histogramming parameters can also be included, as only the most basic are in the current version. Finally, masked versions of these classes are also likely to be useful. This should be relatively simple to implement using the masked histogram infrastructure. Hopefully these extensions can be implemented in the future.
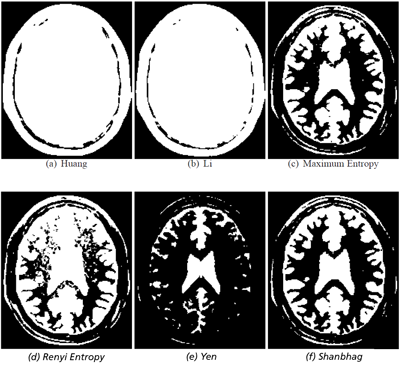 Figure 3: Thresholded images.
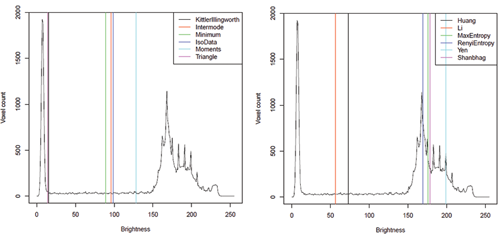
Figure 4: Image histogram and thresholds selected
by implemented methods.
References
[1] L.K. Huang and M.J.J. Wang. Image thresholding by minimizing the measures of fuzziness. Pattern recognition, 28(1):41–51, 1995. 1, 2.1
[2] J.N. Kapur, P.K. Sahoo, and A.K.CWong. A new method for gray-level picture thresholding using theentropy of the histogram. Computer vision, graphics, and image processing, 29(3):273–285, 1985. 1, 2.5, 2.6
[3] J. Kittler and J. Illingworth. Minimum error thresholding. Pattern recognition, 19(1):41–47, 1986. 1, 2.7
[4] G. et al Landini. Auto threshold. 1
[5] C.H. Li and C.K. Lee. Minimum cross entropy thresholding. Pattern Recognition, 26(4):617–625, 1993. 1, 2.4
[6] C.H. Li and P.K.S Tam. An iterative algorithm for minimum cross entropy thresholding. Pattern recognition letters, 19(8):771–776, 1998. 1, 2.4
[7] A. Niemist. Histthresh toolbox for matlab. 1
[8] J. Prewitt and M.L. Mendelsohn. The analysis of cell images. Annals of the New York Academy of Sciences, 128(3):1035–1053, 1965. 1, 2.2
[9] T.W. Ridler and S. Calvard. Picture thresholding using an iterative selection method. IEEE transactions on Systems, Man and Cybernetics, 8(8):630–632, 1978. 1, 2.3
[10] A.G. Shanbhag. Utilization of information measure as a means of image thresholding. CVGIP: Graphical Models and Image Processing, 56(5):414–419, 1994. 1, 2.10
[11] W.H. Tsai. Moment-preserving thresholding: A new approach. Computer Vision, Graphics, and Image Processing, 29(3):377–393, 1985. 1, 2.8
[12] J.C. Yen, F.J. Chang, and S. Chang. A new criterion for automatic multilevel thresholding. Image Processing, IEEE Transactions on, 4(3):370–378, 1995. 1, 2.9
[13] G.W. Zack, W.E. Rogers, and S.A. Latt. Automatic measurement of sister chromatid exchange frequency. Journal of Histochemistry & Cytochemistry, 25(7):741, 1977. 1, 2.11

Richard Beare works in the Stroke and Ageing Research Group at Monash University and the Developmental Imaging Group at the Murdoch Childrens Research Institute, where he is responsible for the development of automated image analysis tools for brain, cardiac and other imaging studies. He has extensive experience in theoretical and applied aspects of image analysis.

Gaëtan Lehmann is a biologist/software engineer at the French National Institute for Agronomical Research (INRA) where he studies the dynamic organization of the genome in early mammalian embryos. His strong open source background has led him to contribute most of his developments to ITK, including several packages in the mathematical morphology field and WrapITK.
Dear sir,
Can you please share the code of [1] and [2]