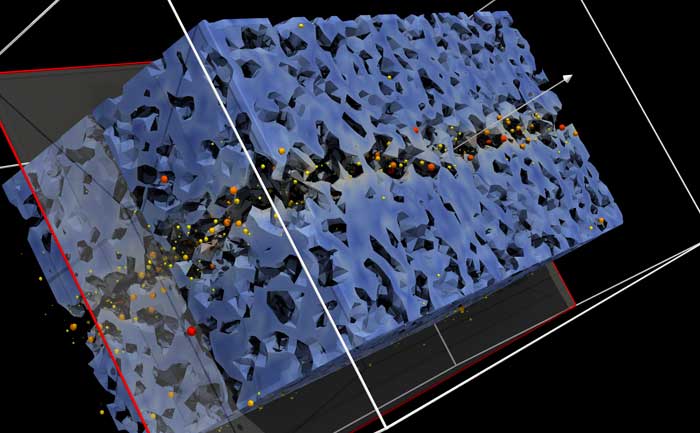
Interactive Visualization and Analytics
At Kitware, data analysis and visualization are at the core of everything we do. Founded around the Visualization Toolkit (VTK), we’ve grown significantly while keeping visualization in our DNA.
Flexible Solutions for Diverse Needs
By combining these platforms, we deliver both turnkey and custom visualization solutions. Whether you need support for existing ParaView workflows or a complete end-to-end visual analytics solution tailored to your specific requirements, our flexible approach accommodates diverse workflows across various domains.
Deployment at Any Scale
Our tools deploy seamlessly across platforms, from client-side browser applications to massive supercomputer installations using thousands of processes with a client-server architecture. Our Catalyst in situ analysis support enables tighter integration with your existing tools by directly embedding visualization into running applications, including large-scale simulations.
Proven Track Record
Our solutions have powered milestone HPC achievements, including the first known in situ run to exceed one million MPI processes. Whether you’re modernizing legacy workflows or designing next-generation simulations, Kitware helps you build faster, more adaptive systems for scientific and engineering discovery.
Our Visualization Platforms
Our comprehensive suite of visualization tools includes:


Let’s build the tools that bring your data to life. Contact us to start your project.