Isolines in GeoJS
GeoJS is an open-source library for geospatial and large-scale image visualization which aims to make it easy to visualize data from observations and model outputs. While there are several libraries for doing basic slippy-map viewing, many of these libraries only provide low-level primitive functions for drawing elements such as points, lines, polygons, and text. Thus using these tools requires data scientists to add a large amount of boilerplate code to process data to a format which then can be visualized as geometry or image. However, such techniques do not completely satisfy the visualization need and often are non-interactive.
For example, it is common for geoscientists to produce scalar-field data in a grid format with a value at each element or point in the grid. The grid can be a square grid, a squarely-connected mesh, or a triangular irregular network (TIN). To this end, we introduced an abstract mesh class in GeoJS that enables common treatment of any of these mesh styles. Given such a mesh, there are now two built-in visualizations: color contours and isolines.
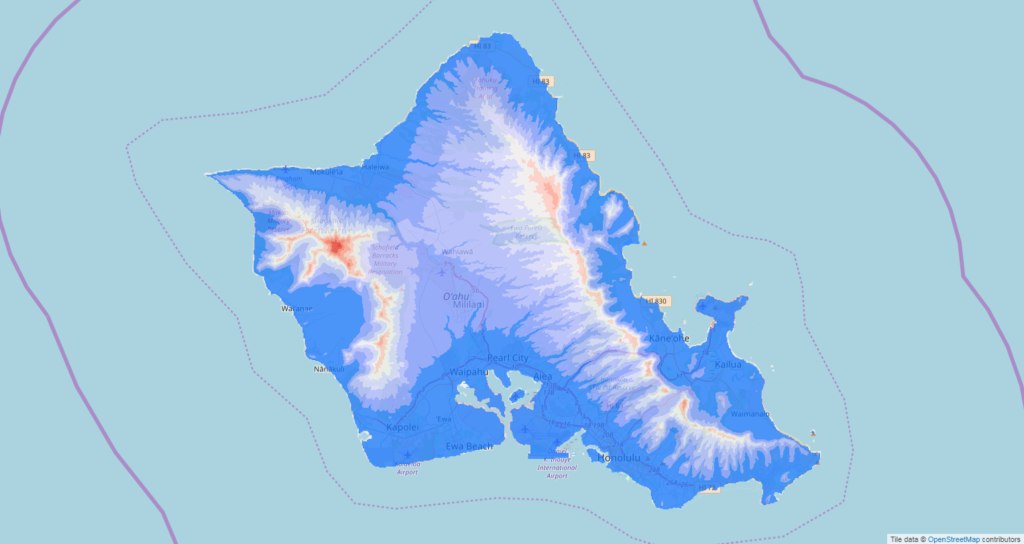
A concrete example of such visualizations are the elevation of Oahu, Hawaii. See geojs/examples/contour for a color contour example and geojs/tutorials/contour for an interactive notebook-style tutorial. In these examples, the colors help visualize the data. It is still hard to locate precise locations within the data, especially when multiple value thresholds need be seen within the display.
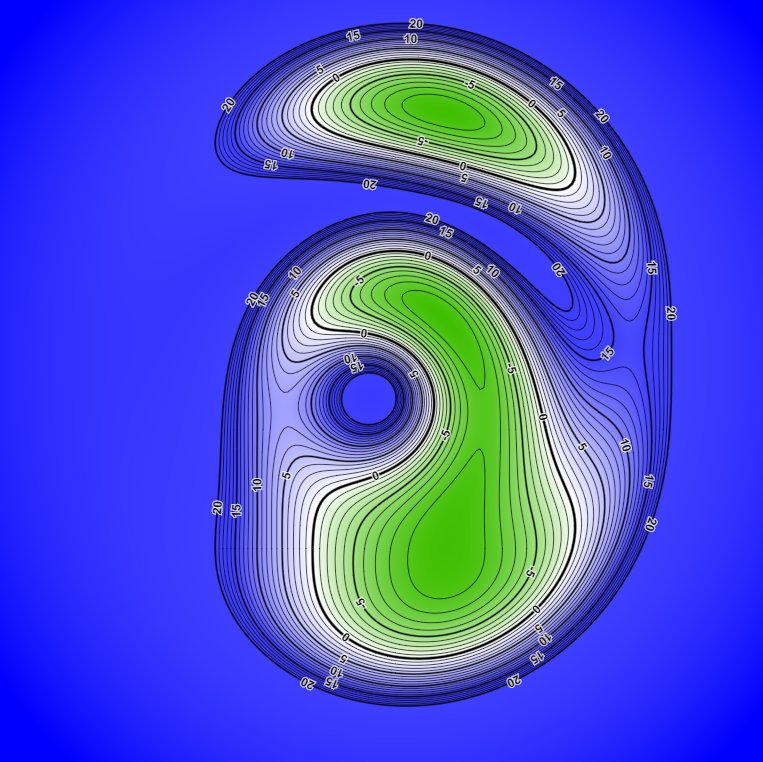
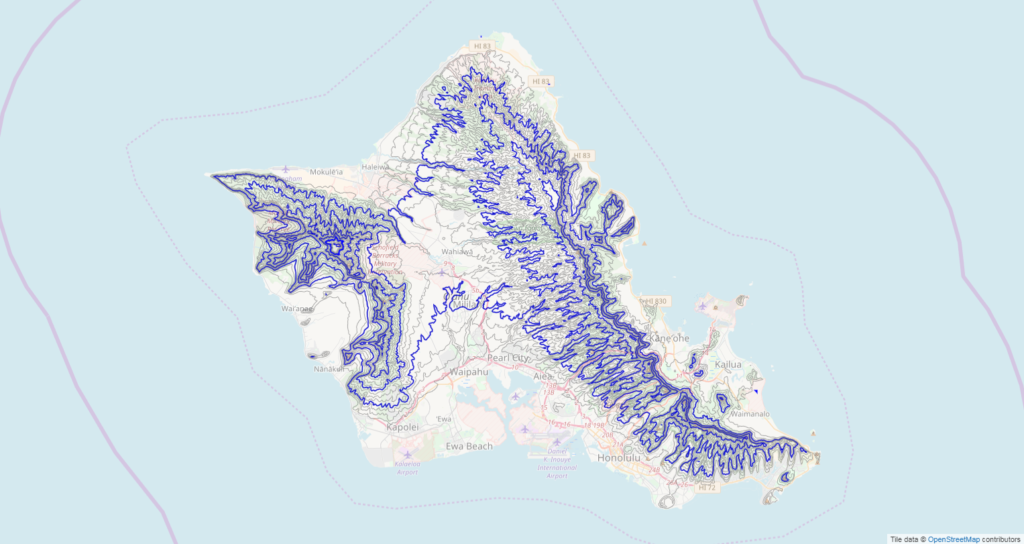
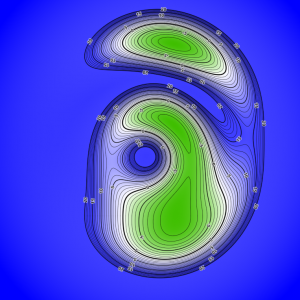
To address this, an isoline feature was added to GeoJS. The same Oahu elevation data can be seen as isolines geojs/examples/isoline, with a tutorial at geojs/tutorials/isoline. The default isoline feature automatically finds the range of values in the data and picks approximately 15 evenly-spaced isolines to draw. Internally it uses the marching-squares or marching-triangles algorithm to generate the lines. Value labels default to every fifth line and are placed so the top of the text indicates the direction of high values. The isoline display is completely configurable: the number and spacing of isolines, the weight, and color of isolines, the format that numerical values are printed, etc. Lines don’t have to be uniformly spaced within the data. The tutorial shows off many of these features.
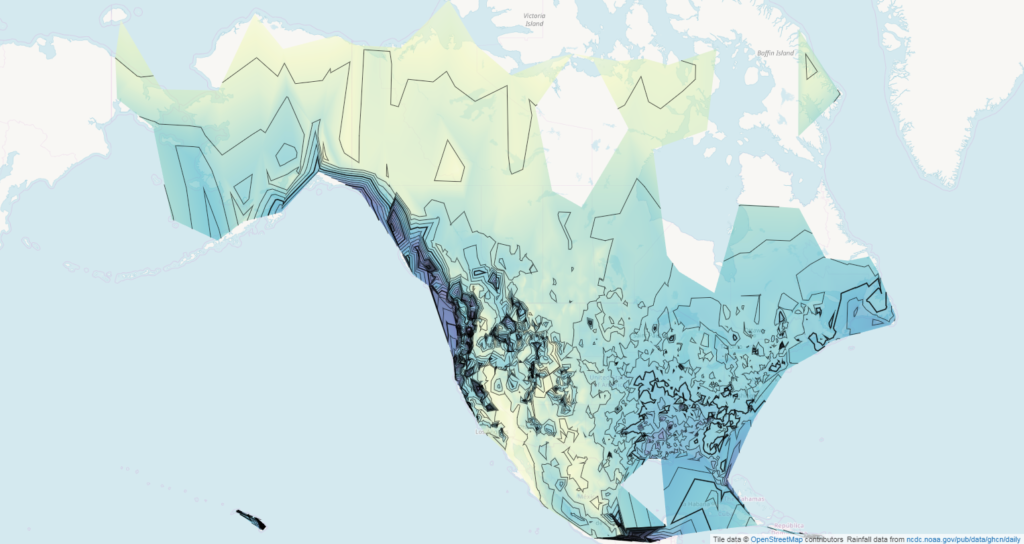
As a second example, geojs/examples/rainfall displays annual rainfall for North America. This data was obtained from a NOAA public site and converted into a TIN format for every available year. The data is then visualized in inches of annual rainfall as isolines and as contour colors. The isolines and colors enable easy comparison of different years — in the American southwest, the 1930s were much drier than the 1980s.
In another example, the data is not loaded from a source file but synthesized from a mathematical function. To demonstrate this example, another feature of GeoJS is utilized in which tutorials source code are stored in the URL. This feature works on browsers like Chrome and Firefox but hits the limits on older browsers like IE. This link will open a tutorial with custom source code.
Isolines and contours are just two examples of many features available in GeoJS. Please check out the example and tutorials page for more online demos. This work has been funded by Defense Threat Reduction Agency (DTRA) for Geospatial Utilities and Model for Biosurveillance Operations (GUMBO) project. For any questions or help with geospatial analytics, please contract kitware@kitware.com.