Kitware Introduces Pan3D: a Collaborative & Interoperable Visualization Tool
Overview
Data scientists frequently deal with extensive data structures that span multiple dimensions. These structures, termed n-dimensional (N-D) arrays, emerge from sophisticated, domain-specific algorithms. Kitware is working on a new framework, Pan3D, that leverages open source tools Trame and PyVista, aimed at simplifying a data scientist’s workflow when analyzing such data. This article delves into Pan3D features, specifically its viewer, to offer insights into how it can be effectively integrated into your data analysis workflow.
Introduction
Data scientists’ research workflow encompasses a variety of complex steps ending in the generation of results through custom code such as numerical simulations or machine learning models. The output from these processes often takes the form of an N-D array using formats like HDF5, NetCDF, and NumPy. However, the subsequent stages, including visualization, validation, and verification are often performed in different environments, varying from one collaborator to another. This diversity in approaches, coupled with frequent use of ad-hoc scripts or manual methods for data transfers and transformation, poses significant challenges. Such practices lead to difficulty in replicating visualizations and insights derived from them, hindering collaborative efforts and consistency in research findings.
Pan3D addresses the fragmented workflow by providing an interoperable 3D visualization viewer, complete with an intuitive interface for data exploration. Specifically designed to integrate seamlessly into the environment where data is generated, Pan3D aligns perfectly with evolving practices of domain scientists in both academia and industry. The increasing adoption of the Python data science software stack, particularly NumPy and Jupyter environments for interactive and collaborative experiences, is well catered by Pan3D. Pan3D’s full compatibility with this stack allows for effortless integration. It can be embedded as a widget within a Jupyter notebook, enhancing the interactive experience, or it can be executed as a server in any other Python context, offering flexibility and ease of use in various research scenarios. In the next section, we have described the steps to leverage Pan3D in your workflow.
Quick Start
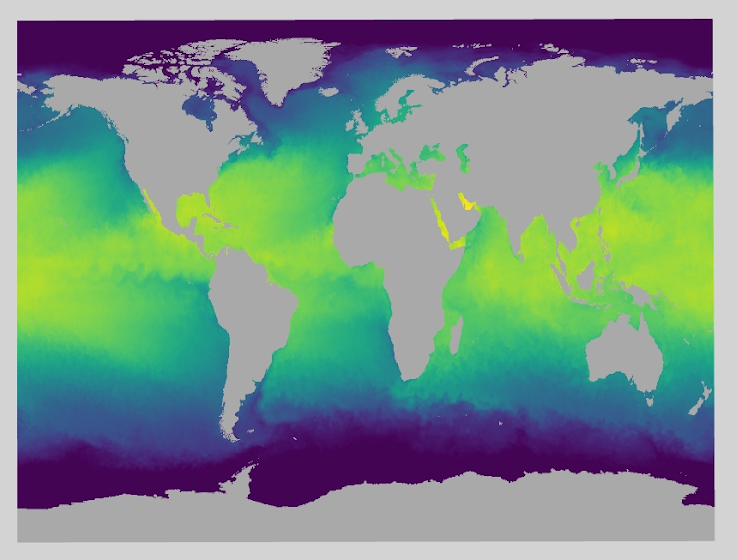
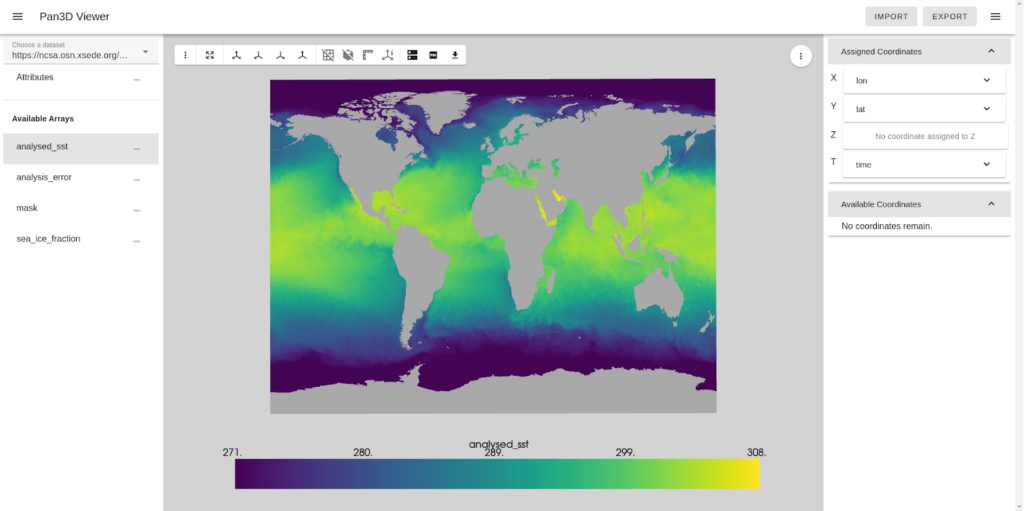
A simple way to get started with Pan3D is to browse example datasets which contain data in the xarray format. To accomplish this, follow these basic steps:
- Installation: Begin installing Pan3D in your Python environment using the command:
pip install pan3d - Running the Viewer:
- To access and browse examples that come with Pan3D, simply launch the viewer with the command:
pan3d-viewer - For an expanded selection that includes Pangeo Forge examples, use the command:
pan3d-viewer --pangeo
- To access and browse examples that come with Pan3D, simply launch the viewer with the command:
Tutorials & Examples
Pan3D’s documentation is continually expanding with a series of user-friendly tutorials, each carefully designed to provide a thorough understanding of the tool’s varied features. These tutorials are particularly beneficial for new users, guiding them through the different functionalities and aspects of Pan3D. The available tutorials include the following:
- How to Use the Pan3D Viewer: This tutorial walks you through the basics of navigating and utilizing the Pan3D viewer.
- How to Run Pan3D as a Local Python Server: For those interested in a more advanced setup, this guide demonstrates how to run Pan3D as a local server within a Python environment.
- How to Use Pan3D in a Jupyter Notebook: Ideal for users who prefer working in a Jupyter notebook, this tutorial explains how to integrate and use Pan3D in such an environment.
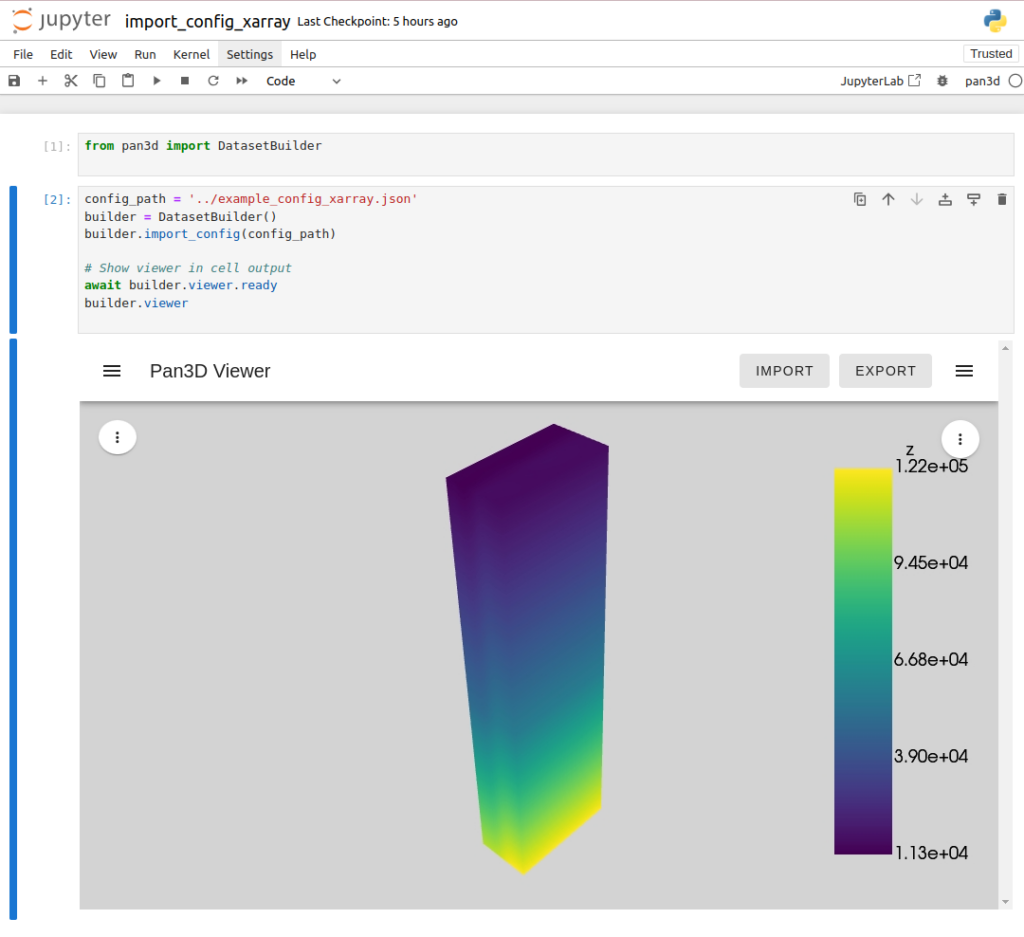
Pan3D provides an array of resources, including sample Jupyter notebooks and configuration files, accessible for exploration on Binder. These examples are instrumental in demonstrating the application of configurations and rendering techniques using Pan3D’s DatasetBuilder class. This class is designed to facilitate user management of various data aspects such as specifying the current array, assigning coordinate axes, slicing data, and customizing render options. Additionally, users can find a notebook showcasing advanced rendering techniques, highlighting direct manipulation of the mesh generated by the DatasetBuilder.
Conclusion
Integrating interactive 3D visualizations into existing workflows is straightforward and efficient with Pan3D, achievable with just a few lines of code. Pan3D enables data scientists to create and save numerous visualization configurations, which can be shared with and effortlessly replicated by collaborators. Each of these visualization configurations are capable of representing a unique subsampling of the dataset, without necessitating data duplication, thus helping to reduce data redundancy.
Incorporating Pan3D into your scientific computing workflow can be a pivotal step in transforming raw data into insightful visualizations. It offers a cohesive and reproducible approach to create highly interactive visualizations that easily integrate into the existing Python ecosystem.
Should your team be considering Pan3D and have queries regarding issues specific to your domain, feel free to reach out to Kitware. We are available to discuss the development and integration of customized data loaders, tools, and visualization options to suit your unique requirements.
This work is funded by the US Department of Energy’s Office of Biological and Environmental Research (BER) to develop Pan3D, an open source toolkit supporting scalable and reproducible scientific workflows for 3D data analytics.