New Features in ParaView for Chemistry
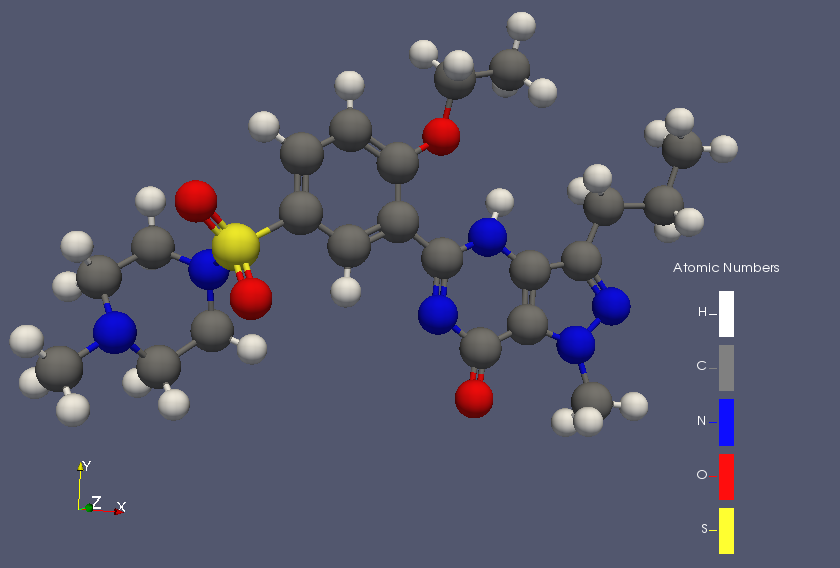
The ParaView project already has a number of features for chemistry, but in the last few days we have merged a number of additional features you may find useful. One of the most widely applicable is a legend that clearly shows the element to which each color in a molecule corresponds. We have wanted to add this feature for a while, and if you don’t know the JMol element colors it can be tough to discern meaning without it! We were able to build on previous work that adds support for enumerations to the color bar (as shown below).
We have added a number of features to the underlying vtkMolecule data structure, including full support for client-server communication, the use of color maps to color atoms by other values (e.g. kinetic energy), and the display of a unit cell. A related feature addition allows ParaView to read in Voronoi cell tessellations from an external file and display them with the atoms. New filters were developed that count cell vertices or faces, that can be coupled with a threshold filter to enable the display of cells of most interest. In addition, the vtkMolecule data structure, along with the new Vienna Ab initio Simulation Package (VASP) file format readers, support reading in time-series data. ParaView can play animations of time-series and combine them with Voronoi cell tessellations to examine dynamics as a system evolves.
The Air Force Research Laboratory (AFRL) Productivity Enhancement, Technology, Transfer, and Training (PETTT) program funded the developments discussed in this post to provide enhanced visualization and analysis support for researchers working on materials challenges. We aim to add support for time series to more file readers in the future.
Very nice work. It is a good time to advertize another time-aware reader for Chemistry data. I can now use ParaView to display time series of data in the XYZ format.
What I have not succeeded in doing is the display of molecular bonds as seen in the article’s image. Using vtkpython, I am happy using the vtkSimpleBondPerceiver. Have you used the same within ParaView? I did not see it enabled anywhere.
I also wanted to highlight the fact hat I can place atomic labels directly on the atoms (using vtkpython) by using a combination of vtkLabelSizeCalculator, vtkPointSetToLabelHierarchy, vtkLabelPlacer, and vtkLabeledDataMapper. Doing the same in ParaView would be fantastic. VTK/ParaView are starting to look really interesting and powerful for molecular science viz!
Thanks, I was meaning to circle back around and see if the XYZ reader you contributed would now work as expected in ParaView. The example you see was read in from a CML file which contains bonding information, XYZ files lack that and so would not something else such as the simple bond perceiver. I think the legend works well in many cases, but directly labeling atoms would also be a nice addition.
Maybe you need to use the “Compute Bonds” filter.