New in ParaView: Quartile Chart View

To understand the movitation for this, let's take a simple example:
- In ParaView (version 4.3.1 or earlier), let's open can.ex2 dataset. On the Properties panel, make sure that the EQPS variable is loaded, and then hit Apply.
- Now, in the Render View, select a few cells using Select Cells On (S).
- Apply the Plot Selection Over Time filter to plot these selected cells over time.
Then, on the Properties panel, in Display properties section, if you select all available cells in the Composite Data Set Index widget, you'll get something like this:
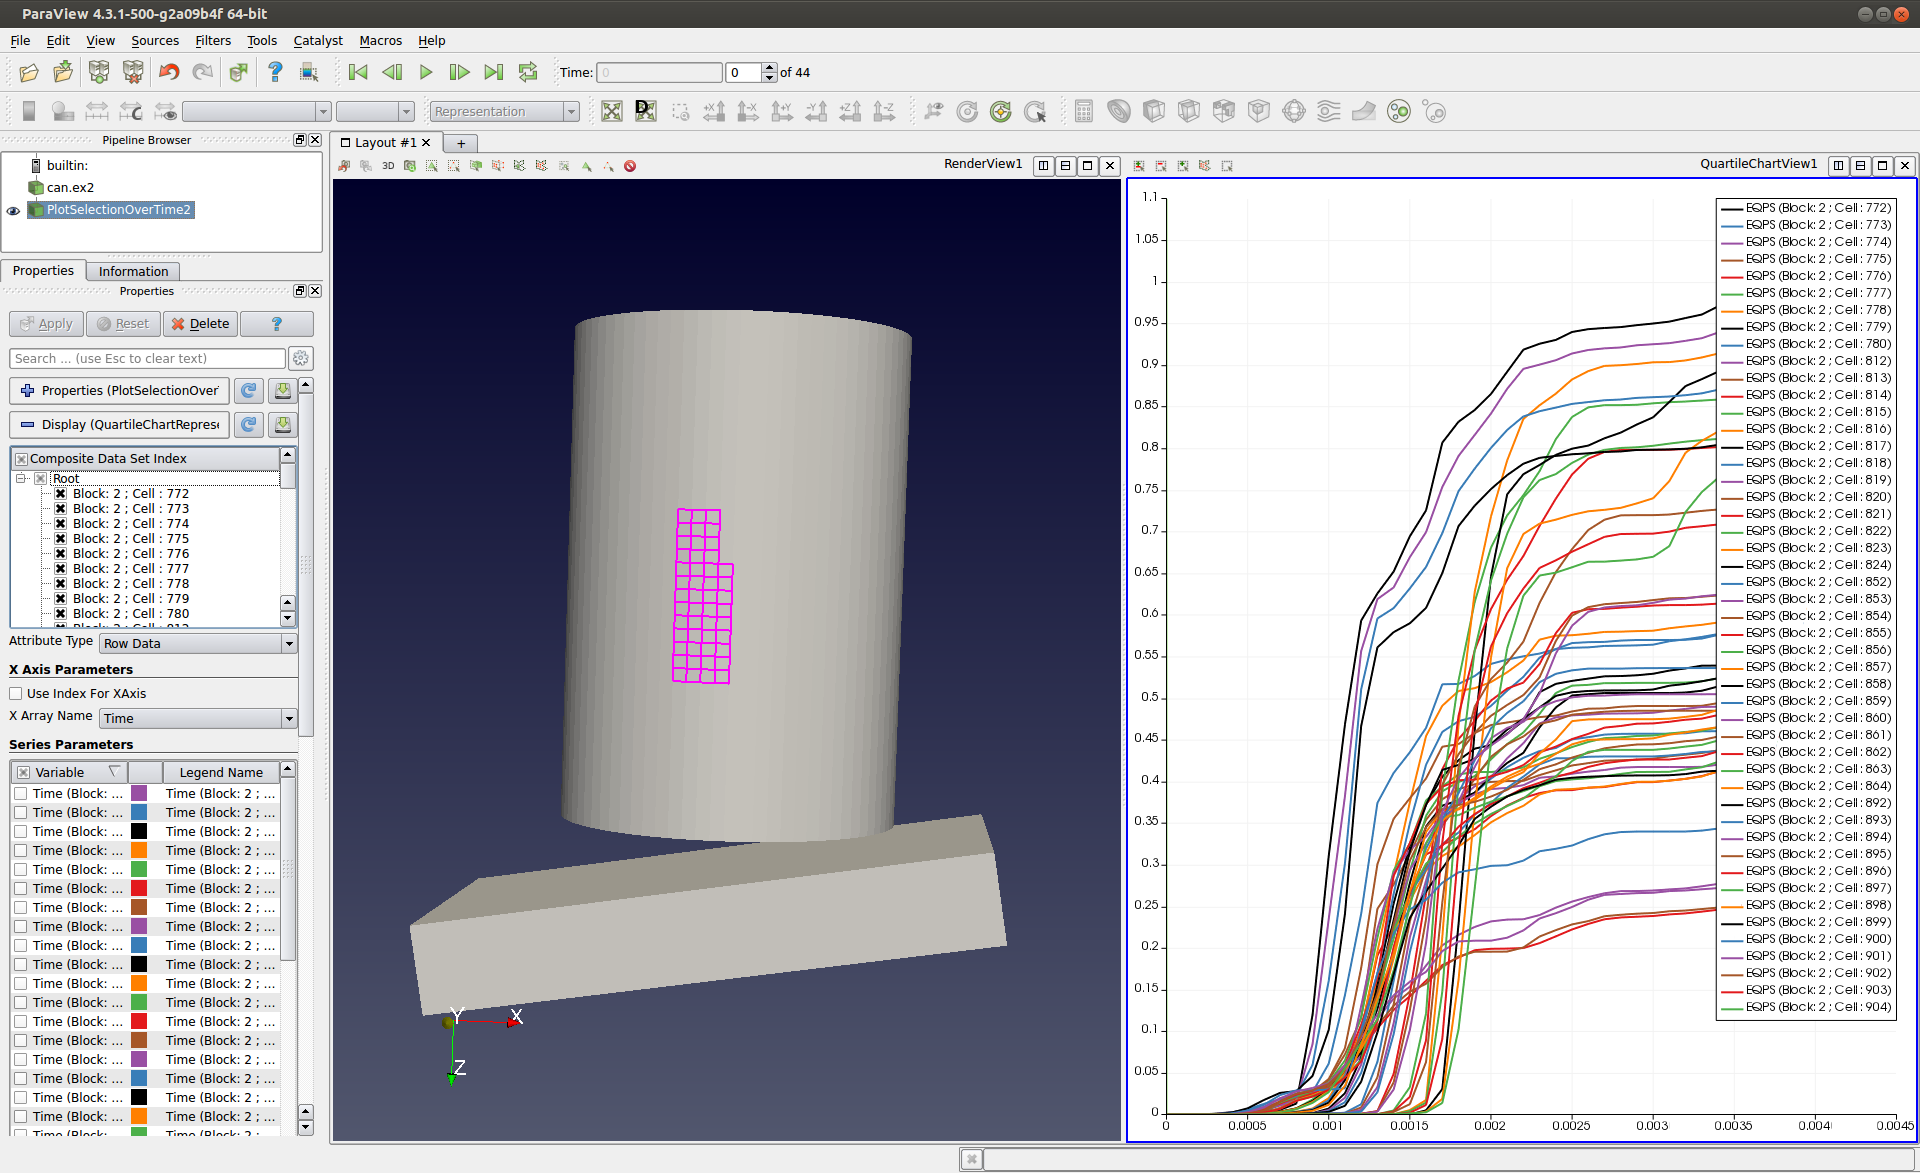
While this is okay for a few cells, when the number of selected cells is large (as shown here), the plot becomes useless fairly quickly. What one really wants, in such cases, is a quantitative summary of the attribute values for the selected cells. ParaView 4.3.1 supports that too!
- Check the Only Report Selection Statistics property on the Properties panel for the Plot Selection Over Time filter, and hit Apply.
Then, after enabling only the series that relate to variables of interest (in our case EQPS), you get something like this:
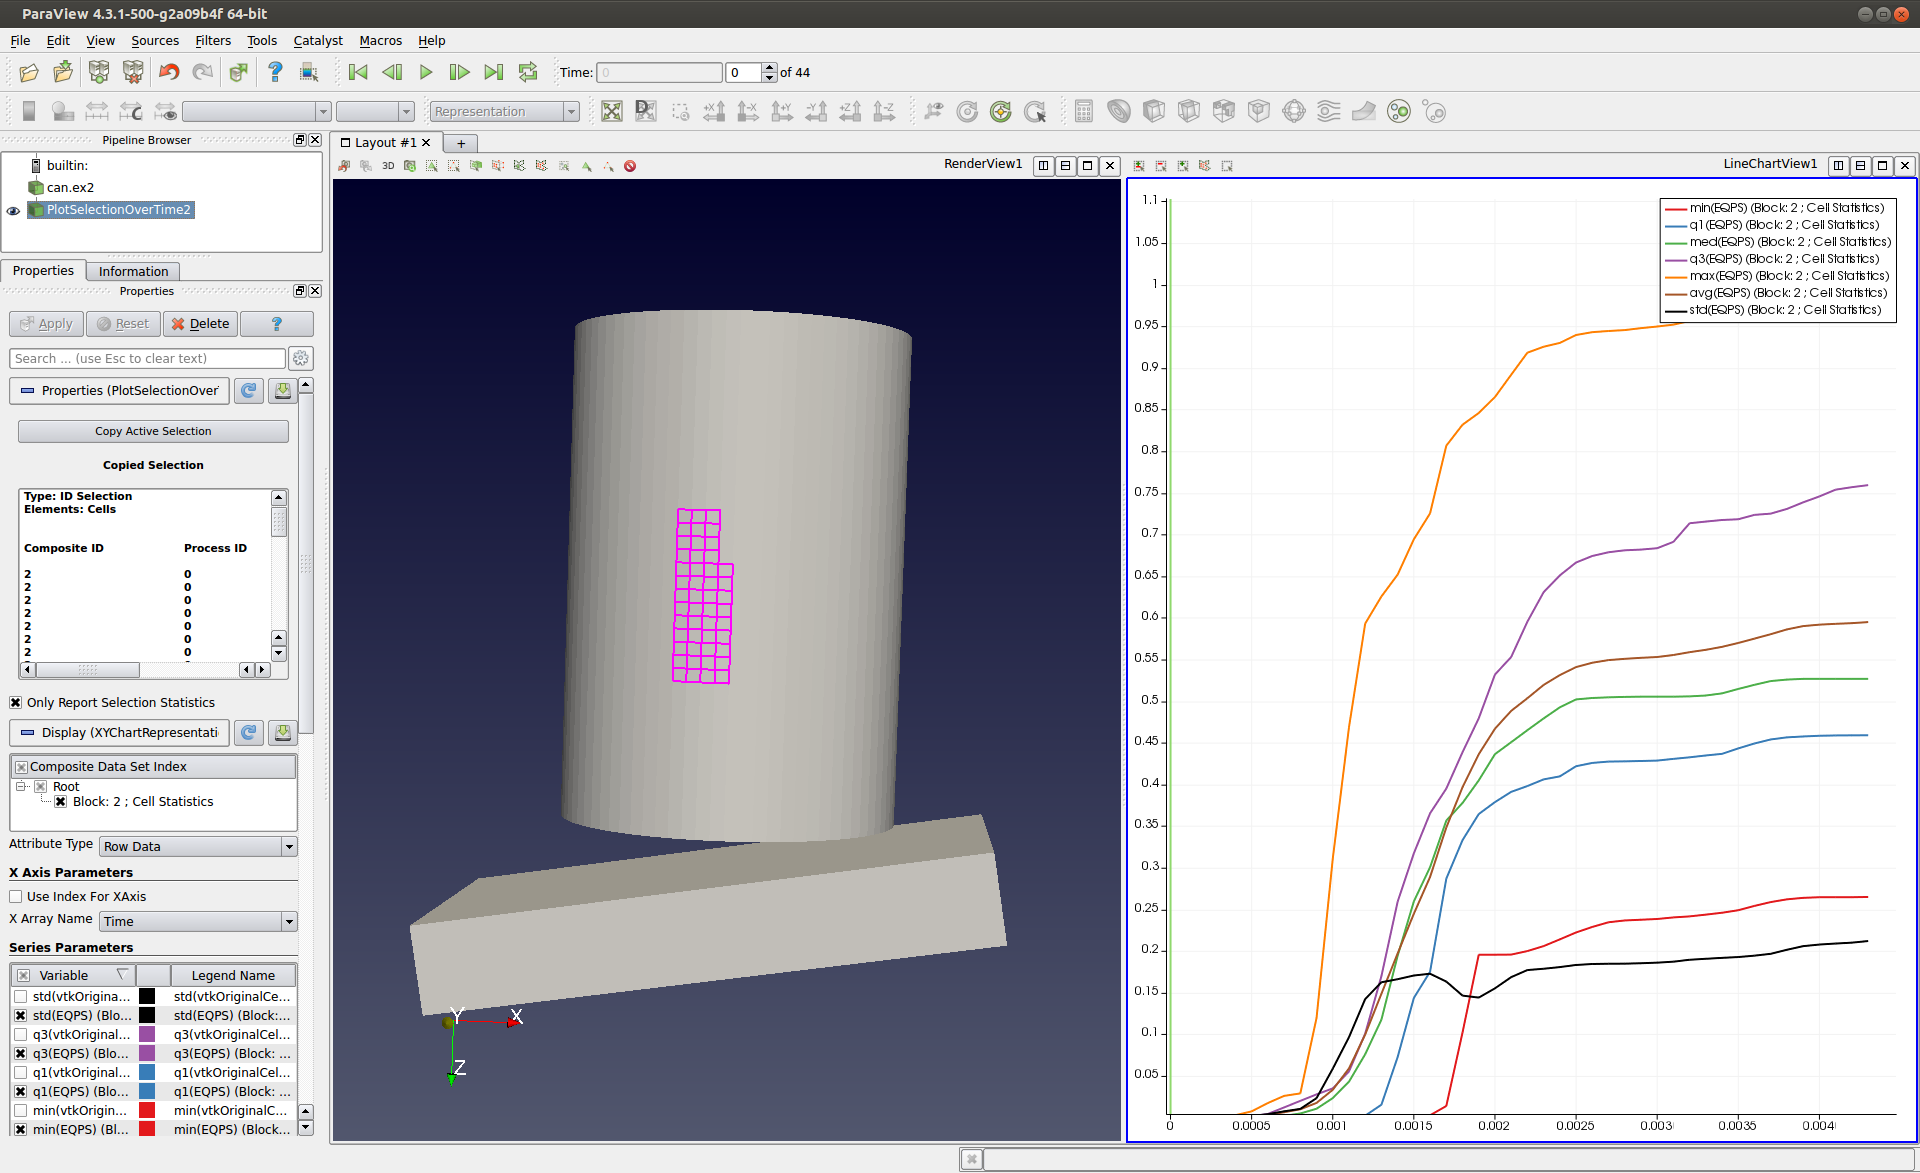
Now you see the plots for min, max, q1, q3, std, avg for the variable EQPS for all selected cells over time! Better, but this too can get very confusing when there are multiple variables that are being plotted. Can't we do better ??? With the latest round of changes that landed in ParaView today, the answer to that is YES!!!
Introducing Quartile Chart View. This is now the default view for Plot Selection Over Time filter. Now, performing Steps 1 through 4 will qive you somethings as follow:
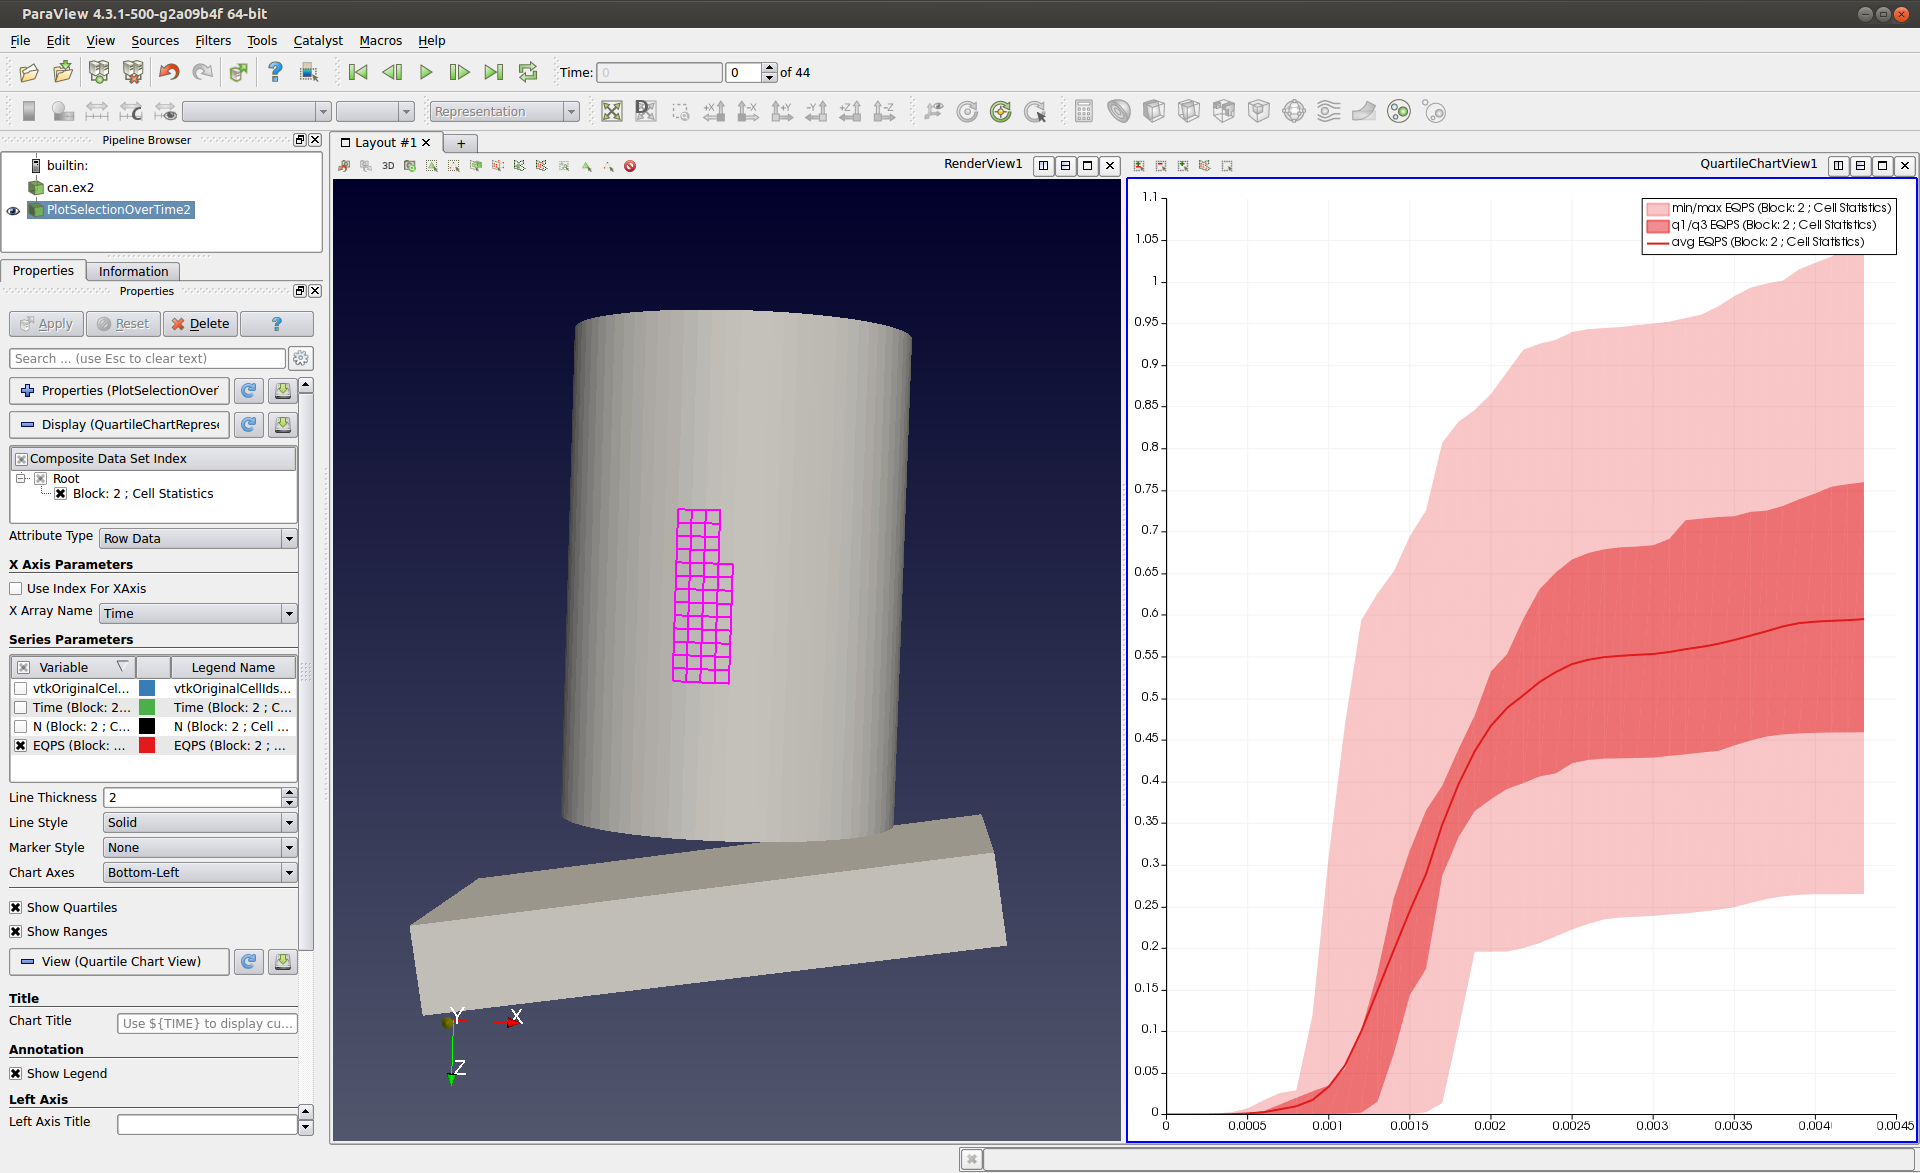
Instead of showing separate line plots, this new view shows the avg value as a line, while coloring the area between min-max, and q1-q3 (upper/lower quartile) ranges, as shown, making the results easier to understand. You can toggle the visibility of the quartile and/or min-max regions using Show Quartiles and Show Ranges properties on the Properties panel (Display section). This also simplifies the Series Parameters checkboxes in the Properties panel, with fewer variables to select.