ParaView 5.5.0 Release Notes
ParaView 5.5.0 is now available for download. The full list of issues addressed by this release is available here. Major changes made since ParaView 5.4.1 include the following:
Rendering Enhancements
More updates to OSPRay ray traced rendering
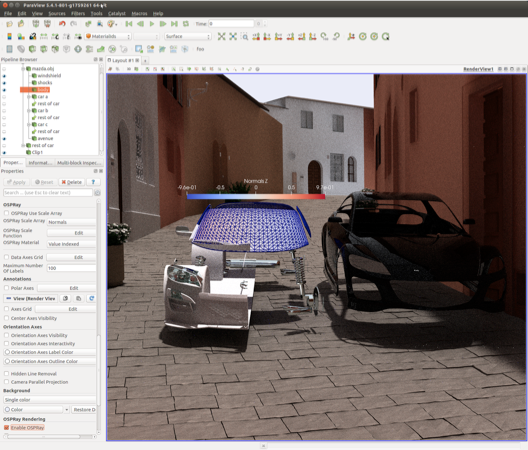
ParaView’s Ray Traced Rendering capacity continues to evolve. In this release we’ve updated to a new version of OSPRay that gives us the ability to directly volume render Overlapping AMR and Unstructured Grid data in addition to the Structured Grid that we’ve had for a couple of releases now. We’ve also exposed a path tracing option for surface geometry. What this does is give the capacity for full photorealism by sampling the scene with many more rays and ray bounces than before. For this purpose we’ve added the Light Inspector panel in which you can add, remove and more precisely control an arbitrary number of lights in the scene. The Light Inspector’s radius control, which results in soft shadows with the path tracer, is the only part of the panel that is specific to OSPRay, the rest is also useful for standard rendering. Also, for the purpose of photorealism, we’ve added an ability to import JSON-based OSPRay Material specification files. Materials are a way to give objects, blocks, or cells advanced textures and arbitrary appearance properties that make them look like metal, glass, and other real world effects. Note that many features of the path tracer (like shadows before and reflections and refractions now) will result in rendering artifacts in distributed memory parallel runs.
|
| OSPRay path tracer combined with typical visualization capabilities. |
NVIDIA IndeX Plugin Included
NVIDIA IndeX™ is a visualization SDK that leverages GPUs for scalable, real-time visualization and computing of multi-valued volumetric and geometric data. NVIDIA IndeX as ParaView plugin is developed in collaboration with Kitware to accelerate large scale volume rendering for both structured and unstructured meshes.
We have simplified access to the plugin by integrating it natively with ParaView’s binaries. Now with ParaView 5.5, you can get the plugin source code and binaries for both Windows and Linux as part of ParaView download. Once the plugin is loaded in ParaView, you simply select NVIDIA IndeX from the “Representation” drop down menu to take advantage of various features like:
- Interactive large scale volume rendering of unstructured and structured meshes.
- Time varying support for structured meshes.
- Advanced visual enhancements such as depth and edge enhancement presets for better insights.
- Rendering multiple volume slices combined with volumetric rendering.
- Depth correct mixing with ParaView primitives.
For more details, please see the blog post about the NVIDIA IndeX Plugin in ParaView 5.5.
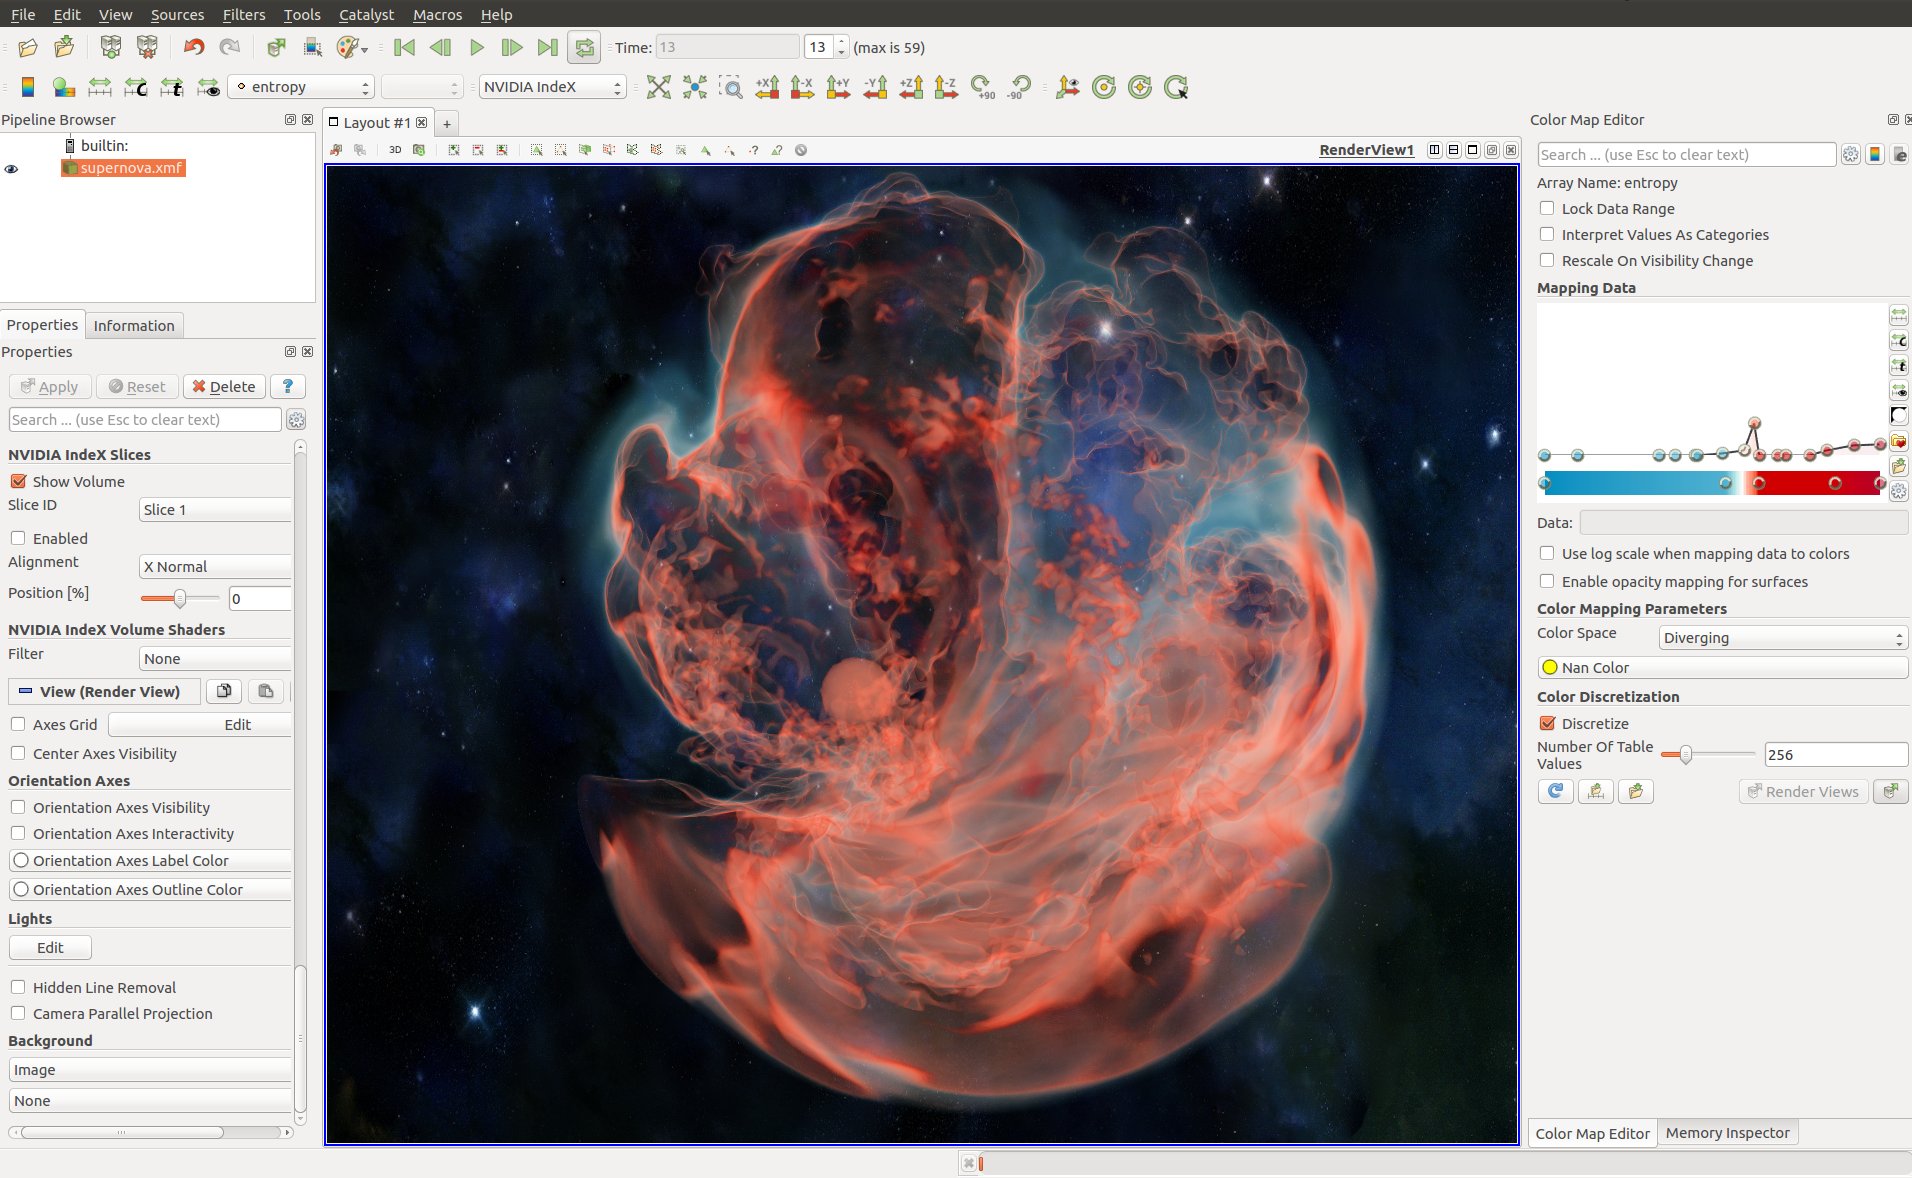 |
| Supernova rendered in ParaView using NVIDIA IndeX. |
Support for rendering lines as tubes and points as spheres
Using Render Lines As Tubes and Render Points As Spheres properties in the Display section on the Properties Panel, it’s now possible to render lines as 3D tubes and points as 3D spheres.
Preview mode
To make it easier to generate publication quality images, ParaView has a new Preview mode. Preview mode is similar to the Print Preview mode offered by many tools, including your web browser. The idea is to provide a way to do final visualization setup just prior to saving a screenshot or animation in a way that minimizes surprise object rescaling in the save image output, which can happen if the ParaView window aspect ratio differs from the requested image resolution aspect ratio. To use Preview mode, select a target resolution from the View -> Preview submenu and the active layout will be resized to match the chosen resolution. If the target resolution is larger than the space available for the layout tab on your screen, it will be resized to match the target aspect ratio.
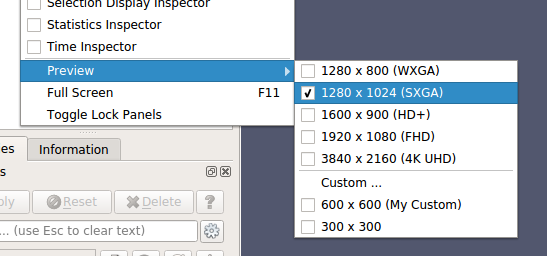 |
| Preview mode resolution size selection. |
Improvements to Eye Dome Lighting with remote rendering.
A number of bugfixes went into the Eye Dome Lighting and IceT layers to allow this screen-space ambient occlusion algorithm to work on parallel/remote render servers.
Embossing plugin
This plugin adds three new representations.
- BumpMap : computes on the GPU fake normals based on the gradient of the selected point data, creating a relief effect.
- Extrusion (cell mode) : computes on the GPU an extrusion based on the value of the cell.
- Extrusion (point mode) : computes on the GPU a height field based on the value of the cell.
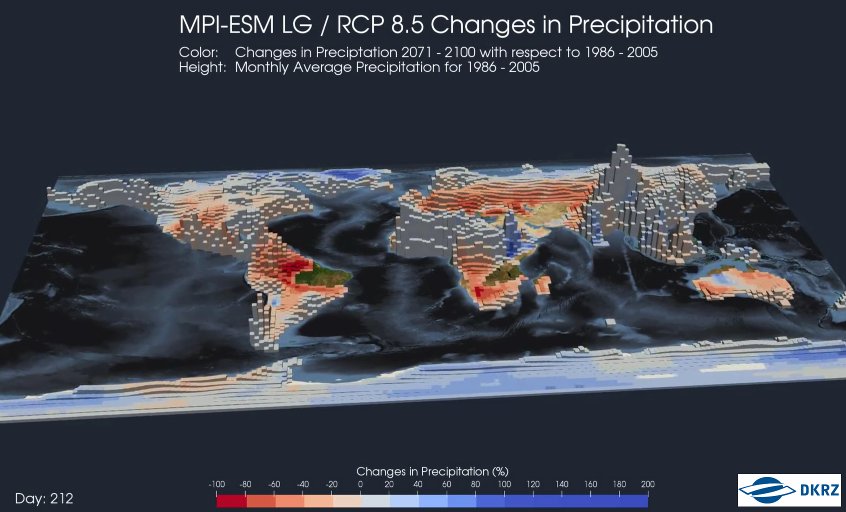 |
| Extrusion map created with the embossing plugin. Data and picture credit: http://www.dkrz.de/. |
Separate color map feature
By default, color maps are shared among data representations, and there is one color map for each data array name. It is now possible to tell representations to use a separate color map instead. The result is that data arrays with the same name can be colored with different color maps. See the blog post about this feature for more details.
Categorical coloration improvements
- Annotation now always has a color, using a default and by looping when adding annotations after the size of the color map.
- Automatic annotation generation can now be forced over its previous maximum (32).
- The Color Legend is now hidden automatically when the number of annotations is bigger than 32.
- Opacity can now be set globally, on the selected category, or on an individual category.
Depth peeling for volumes
This option is now exposed through settings. Enabling it will include volumes in the depth-peeling pass to render intermixed volumes with translucent polygons correctly.
3D Glyphs representation culling
It is now possible to enable culling and level of detail (LOD) in the 3D Glyphs representation. This enables rendering a higher number of glyphs at interactive frame rates. When the option is enabled, instances that are not visible are discarded and not drawn. One can also specify LOD parameters inside a table. The first table column is the distance after which the LOD is enabled, the second column is the reduction factor applied to the instance geometry. It is also possible to display instances in different colors depending on the LOD. Please note that this feature works only with OpenGL driver >= 4.0.
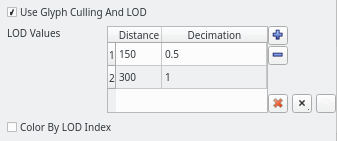 |
| 3D Glyphs representation option in the user interface. |
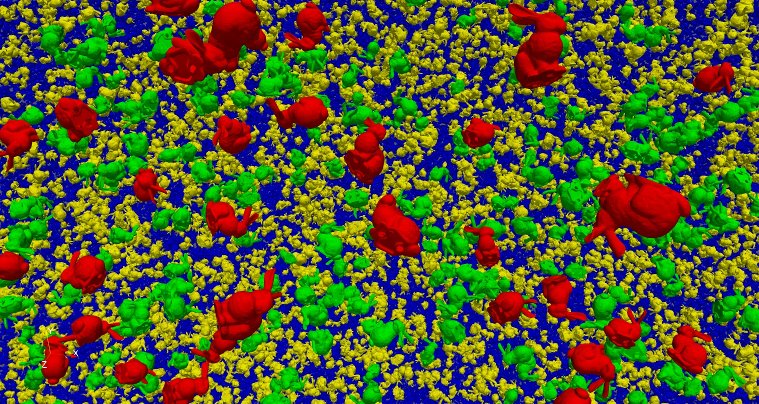 |
| 3D Glyphs rendering 1 million instances of a bunny model. |
Horizontal color legend title in vertical orientation mode
As in earlier versions of ParaView, it is again possible to orient the color legend title horizontally when the color legend is oriented vertically. By default, the title is rotated 90 degrees counterclockwise and aligned with the color legend vertically.
Image volume representation can now render isocontours
Thanks to a recent change in VTK, it is now possible to use the OpenGL-based volume rendering mapper to display isocontours without precomputing them on the CPU. This feature is exposed through two new properties on the image volume representation: Show IsoSurfaces to enable the feature, and Contour Values to specify the isocontours values similar to how they are set in the Contour filter.
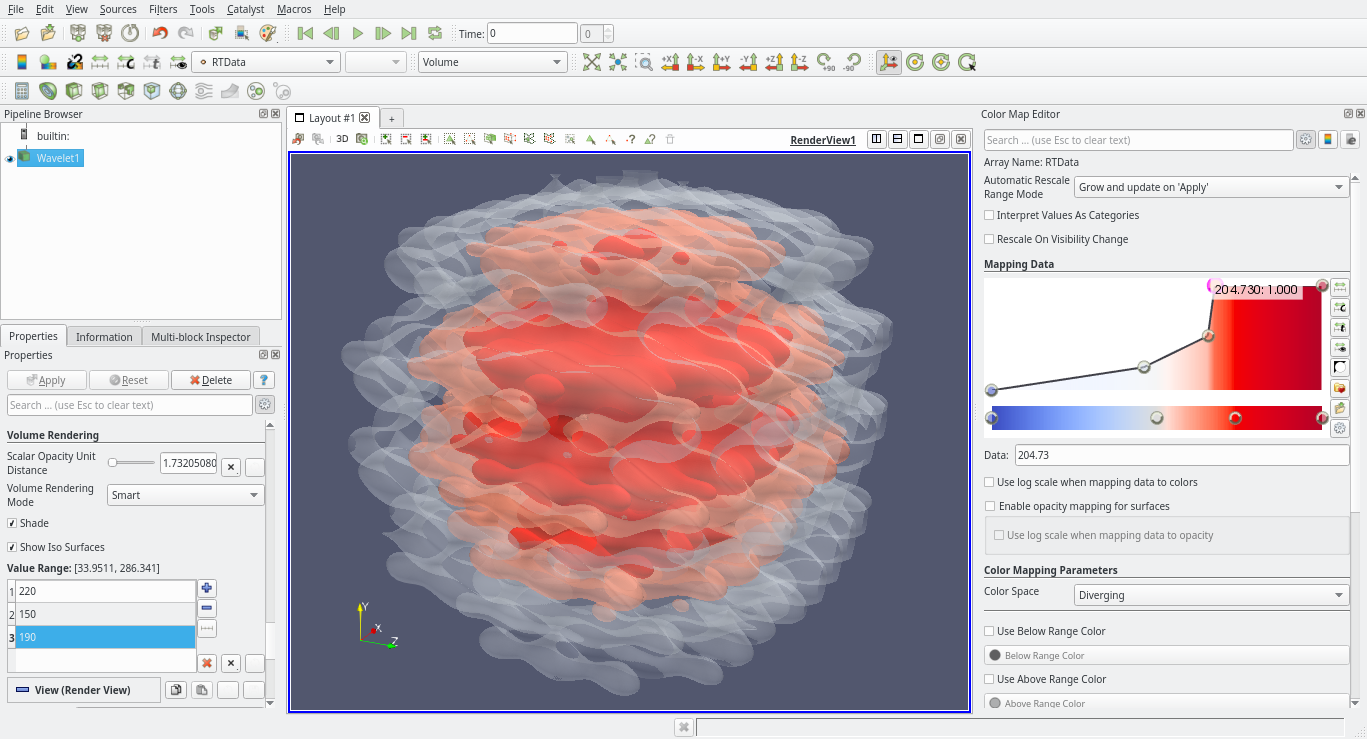 |
| Image volume representation isocontours. |
Major Improvements on the Point Gaussian Representation
The Point Gaussian Representation in ParaView has been improved to include:
- A bug fix that increased performance three-fold
- An option to write Custom Shader from within ParaView user interfae
- An option to use Opacity and Scaling not only with a Scalar Array but also with a Vector Array by selecting the component to use or the magnitude
- Opacity and Scale transfer functions are now dynamic and automatically adjusted
- Multiple improvements to the user interface
- Enabling of Point Gaussian Representation for every point-based data set type
For more information, please read the blog post about these improvements.
New Features
Python shell is now in a dockable widget
ParaView 5.5 supports docking the Python shell in the UI. Docking makes it easier to always have easy access to the Python shell for those among us who enjoy writing code as much as clicking on buttons. The location of the menu item to bring up the Python shell has moved from the Tools menu to the Views menu. See this blog post for more details.
Adding filters from the Pipeline Browser context menu
It is now possible to create new filters from the Pipeline Browser context menu. Only filters that are applicable to the active source are shown in the context menu.
Saved custom camera positions
Adjust Camera dialog now allows saving of more than 4 camera positions. The limit has been extended to 30 positions, with a minimum of 4. You can add/remove positions within this limit using the Adjust Camera dialog’s Configure… button.
Added LZMA compressor and compression level setting for XMLWriter
The LZMA lossless compressor is now available when writing XML data files, offering a higher compression ratio and higher write time compared with existing LZ4 and ZLib compressors. A Compression Level setting is now available to fine tune the tradeoff between compressed file size and write time for each compressor.
Arbitrary-order Lagrange finite element support
ParaView’s XML readers and writers support arbitrary-order Lagrange finite elements. The Unstructured Cell Type source can be used to generate representative grids with Lagrange elements.
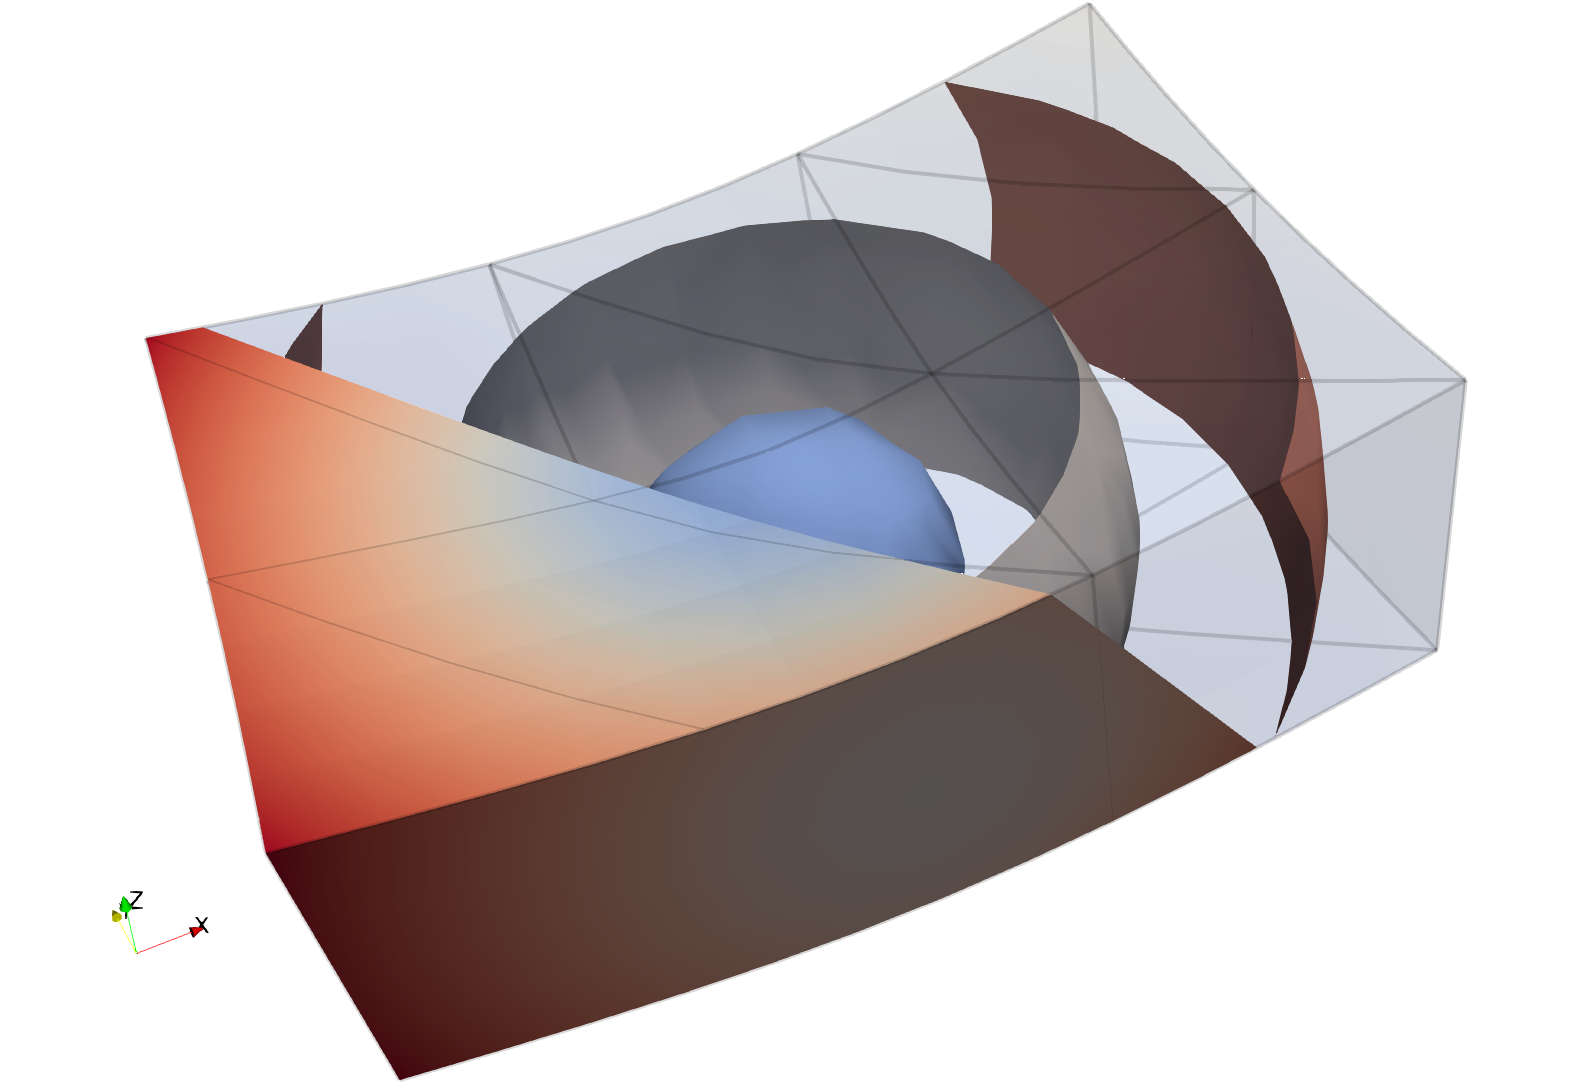 |
| An example of a grid with higher-order wedges. |
Proxy sources selection order is now respected
Previously, the order of selection of the proxies in the pipeline was not respected. For instance, selecting a Box Source first and then a Sphere Source in the pipeline before applying a Group DataSets filter did not ensure that block 0 would be the box. Selection order is now respected
- note that order was already respected when using the Change Inputs dialog.
Introduce a new plugin called DigitalRockPhysics for rock analysis
This plugin introduces two new filters to help the analysis of digital rock.
- The Material Cluster Analysis filter produces a multiblock dataset that contains two blocks:
-
- A table (block 2) that contains the volume (number of cells of every cluster) and barycenter of every cluster (set of connected cells that have the same point data material attribute); and,
- A copy of the input data image (block 1) with new point data arrays that correspond to the volume and barycenter of the material cluster it belongs to.
- The Material Cluster Explode filter creates an exploded surface mesh of the clusters (the set of connected cells that have the same material attribute) described in the input image data.
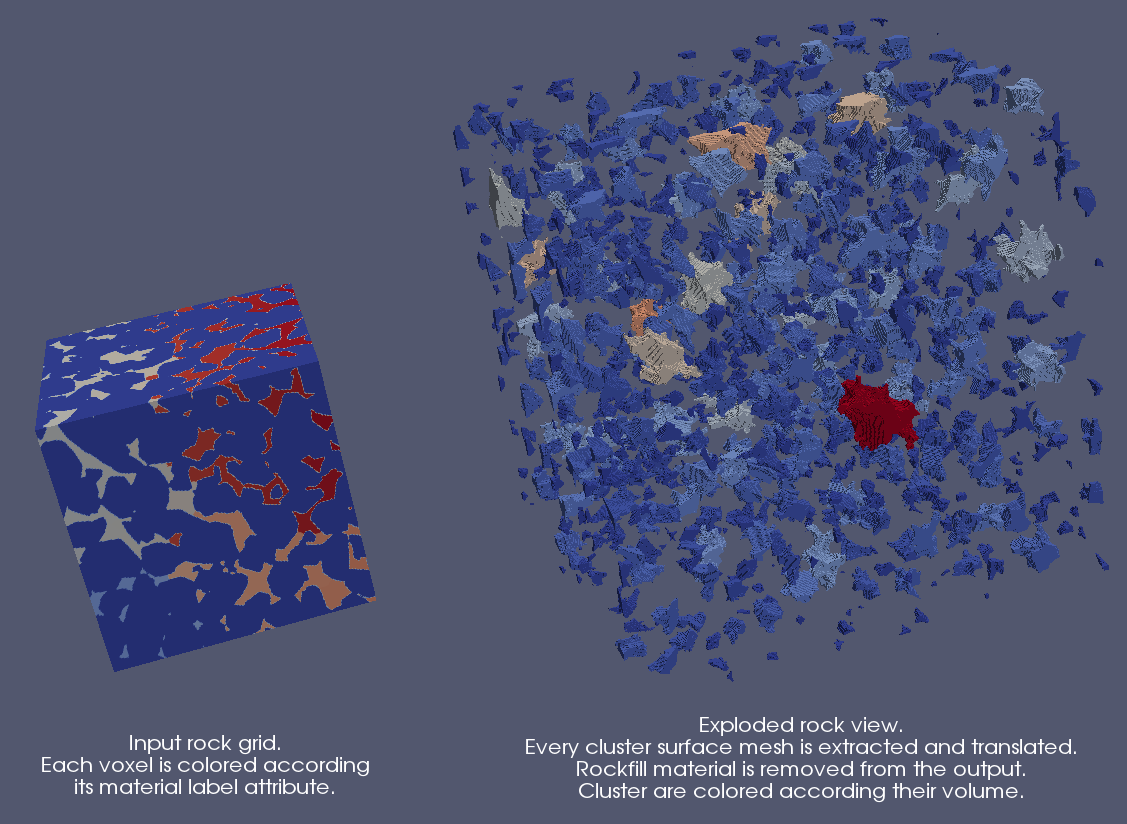 |
| Exploded rock view from the DigitalRockPhysics plugin. |
Expose vtkMolecule type for Programmable Source and Programmable Filter
We add support for vtkMolecule as input/output data type in the Python Programmable Source and Programmable Filter. Molecule type is now also exposed correctly in the Information Panel.
AMReX particles reader
ParaView now supports reading particle data from AMReX plotfiles. The reader supports both single plotfile or multiple plotfiles that form a time series.
JSON based new meta file format for series added
vtkFileSeriesReader now supports a new meta file format based on JSON. This format has support for specifying time values. The format (currently version 1.0) looks like the following
{
  "file-series-version" : "1.0",
  "files" : [
    { "name" : "foo1.vtk", "time" : 0 },
    { "name" : "foo2.vtk", "time" : 5.5 },
    { "name" : "foo3.vtk", "time" : 11.2 }
  ]
}
The reader will interpret any files that end with the .series extension as a meta file. To add support for the meta file for a reader in the readers description, add the extension.series extension to the extension list. For example, for legacy VTK files, the reader now supports .vtk and .vtk.series.
GDAL and PDAL Readers
ParaView now supports geospatial (GDAL Raster and Vector Reader) and point cloud data (PDAL Reader). Any dataset supported by GDAL or PDAL libraries is now supported by ParaView.
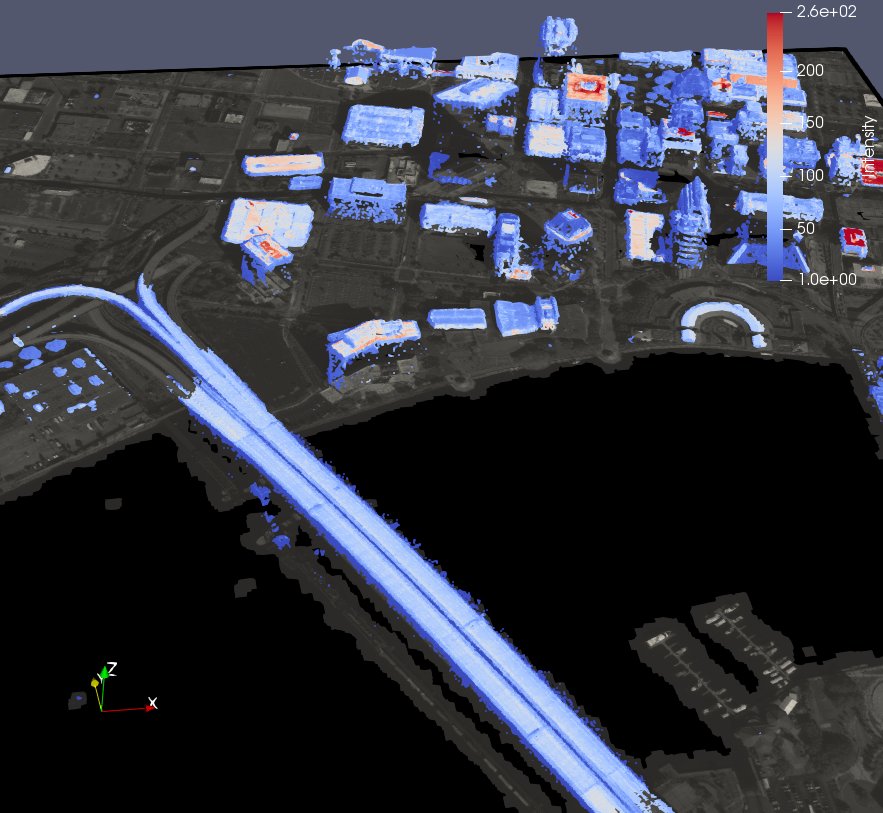 |
| An orthorectified satellite image and a point cloud of Jacksonville, FL, rendered in ParaView. |
CGNS library updated to v3.3.1
CGNS library has been updated to version 3.3.1. This version contains a bug fix that allows loading large files in Windows.
Orienting by quaternion in 3D Glyph representation
When the 3D Glyph representation is selected, one can use a data array to define the orientation of the glyphs. Previously, one had a choice between direction vector or angles around three axes (both by selecting a 3-components array). We added a new Quaternion mode to specify the orientation through a 4-components point array with quaternions defined in WXYZ format.
Plotting full dataset over time
A newly added filter Plot Data Over Time supports plotting entire datasets, and not just the selected subset. When in distributed mode, however, the current implementation show stats for each rank separately. This will be fixed in a future release to correctly compute distributed statistical summaries.
Selecting arrays to read in PVD reader
PVD reader (vtkPVDReader) now supports selecting which arrays to read. This can be useful to minimize memory foot print and reduce I/O times when reading PVD files by skipping arrays that may not be needed.
Restore user preferences to default
ParaView now supports restoring user preferences to default from the Edit menu. One can optionally generate backup files before restoring user preferences to default.
Format-specific options in save animation and screenshot dialogs
Dialogs for save-screenshot and save-animation now show file format-specific options for quality, compression, etc., rather than a single Image Quality parameter which was internally interpreted differently for each file format. This allows the user finer controls based on the file format, in addition to avoiding confusion.
Support of TrueType font files
It is now possible to display 2D and 3D text with TrueType font files you provide, and thus use fonts different from the built-in fonts (Arial, Courier, and Times). This feature is accessible by choosing File as the font family in the Font Properties property and then specifying the full path to the .ttf file in the file selection field.
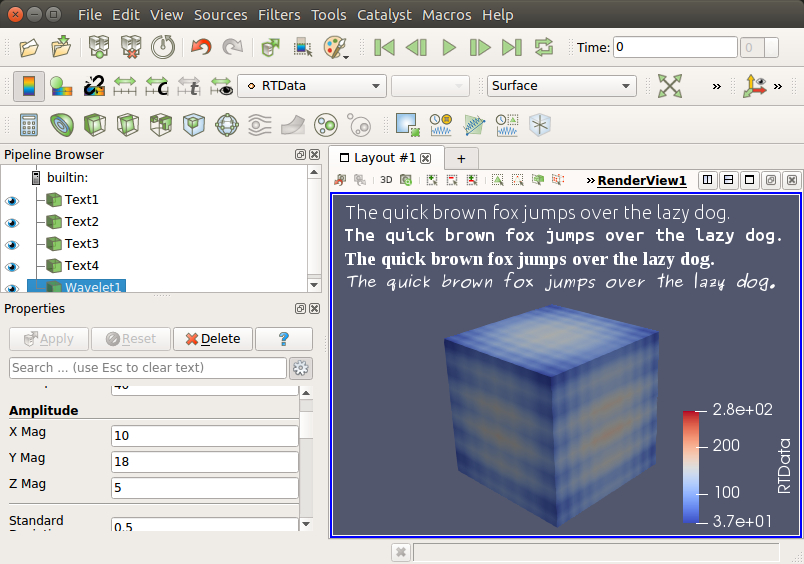 |
| TrueType fonts can now be used for text. |
Upgrade from vtkHyperOctree to vtkHyperTreeGrid
All functionality related to the experimental vtkHyperOctree tree-based AMR implementation has been deprecated in VTK and removed from ParaView. It is being replaced with the newer vtkHyperTreeGrid data structure, which is more efficient and more expressive than its predecessor. The new vtkHyperTreeGrid is a superset of previous implementation. This ParaView release includes a more efficient hyper tree grid implementation than in 5.4 along with VTK XML based IO, a few dedicated filters, and bug fixes.
Clip filter improvements
Clip filter now can clip away the exact exterior of a box. Note, though, that this is an expensive operation as it performs six plane clips in order to provide the exact box clip.
Which portion of the geometry was clipped has been inverted as the default was confusing for the Box, Sphere, and Cylinder. Now, the clipped geometry is interior to the clip shape rather than exterior.
Ghost cell utilities
The Generate Ghosts Cells filter was added. It generates a requested level of ghost cells. The Remove Ghost Information filter will remove ghost cells from datasets.
Filter changes
Attribute arrays appended with the Append Attributes filter are renamed to accommodate inputs with arrays having the same name.
All filters are now available in the GUI regardless of how many pvserver processes are being used. This will allow filters like Process Id Scalars and Generate Ghosts Cells to be easily added with a serial pvserver process with the intent of saving a Python trace, state, or generating a Catalyst Python script that can be properly used in parallel later on.
Added option to specify array type for Calculator filter. This is the available via the new Result Array Type advanced option.
Added the Cell Size filter to measure the number of points for vertex or polyvertex cells, length for 1D cells, area for 2D cells and/or volume for 3D cells.The sizes are output in separate cell data arrays and you can choose which arrays to output. The filter also includes an option to sum the size and will output this in field data arrays.
Added new options for vtkGradientFilter for controlling which cells contribute to the gradient calculation.
Reader and writer changes
A new GenericIO reader provides support for reading Argonnes National Laboratory’s GenericIO files produced by the HACC simulation code. It also allows sampling of the GenericIO files as well as basic filtering operations.
Improved the file series writer to allow specifying min, max and stride for time steps.
Added the ability to read raw images as a time series.
Added option to write out all time steps for XML PVD Writer (i.e. .pvd output files).
Added option to output text files as tab-delimited. The file extension for this is .tsv.
Catalyst
Created a Catalyst volume rendering edition.
We added a volume rendering edition for Catalyst.
Please see the ParaView 5.5.0 Catalyst Changes for a more comprehensive description of Catalyst changes in version 5.5.0.
ParaViewWeb
Several improvements have been made in VTK/ParaView Web to offer better image delivery performances. We added new controls for the server side to manage image resolution and framerate while interacting.
The Web applications have also been updated accordingly to leverage those new capabilities.
ParaView 5.5 bundles the following applications:
- ParaView Visualizer 3.1.0
- ParaView Divvy 1.3.14
Build and Installation Notes
Installation tree cleanup
On Unix, ParaView no longer installs its libraries under <prefix>/lib/paraview-${paraview-version}. Instead, it follows the standard practice of installing them under <prefix>/lib directly.
Python packages built by ParaView are now built and installed under <prefix>/lib/python-$<python-version>/site-packages on *nixes, and <prefix>/bin/Lib/site-packages on Windows. This is consistent with how Python installs its packages on the two platforms. In macOS app bundle, the location in unchanged i.e. <app>/Contents/Python.
Plugins build and installation tree cleanup
Plugins are built and installed in self contained directories named same as the plugin under PARAVIEW_BUILD_PLUGINS_DIR and PARAVIEW_INSTALL_PLUGINS_DIR. These are set to lib/paraview-${paraview-version}/plugins (bin/plugins on Windows) by default. For macOS app bundles too, while the plugins are installed under <app>/Contents/Plugins, they are now contained in a separate directory per plugin.
The .plugins file has also been moved to PARAVIEW_BUILD_PLUGINS_DIR and PARAVIEW_INSTALL_PLUGINS_DIR for builds and installs respectively.
Developer Notes
Easier array selection properties
vtkSIDataArraySelectionProperty makes it easier to expose array selection properties for filter/readers that support an API to toggle selection status using vtkDataArraySelection instance. See vtkSIDataArraySelectionProperty docs for details.
Promote coprocessing plugin’s writers and generator to Catalyst menu
We removed the CoProcessingScriptGenerator plugin and promoted its functions to mainline ParaView. As before they depend on Python and Qt, but otherwise they are now always available. With this we removed the plugin’s two menus and moved their contents under the Catalyst menu.
Client server wrapping property
The ClientServer wrapping tool now uses the WRAP_EXCLUDE_PYTHON property rather than WRAP_EXCLUDE. It also now properly skips classes which cannot be wrapped with no-op wrappings (rather than failing as before). One limitation currently is that files with no classes still need to be excluded since the wrapper does not know what name to use when creating the no-op function.
info attribute for EnumerationDomain
EnumerationDomain now supports info attribute for each of the entries. If present, the UI will show that text in the combo-box rendered for the domain to provide you additional tips for the items to choose.
Adding QToolBar via plugins
ParaView now supports add a QToolBar subclass via the plugin mechanism. In the past, one had to add actions to a toolbar via a QActionGroup. Now, directly adding a QToolBar is a supported by using add_paraview_toolbar CMake function.
New proxy hint WarnOnCreate
Sources and filters XML now supports an ability to add a warning or information message for the user to be shown when creating the source or filter. See WarnOnCreate hint for details.
I’m excited with the work you guys have been doing. Preview mode is a great idea. Question, how do I ‘un-preview’ the screen?
David, thank you for your comments. To exit Preview mode, simply select the same menu item for the preview size (it will have a check mark). The view will be restored to fit in the ParaView window and the menu item will return to the unchecked state.
Thank you guys for the nice work! One question: how do I install this version (5.5.0) and uninstall first RC3 of this same version?
Thanks
Thanks for your feedback!
If you previously installed a binary downloaded from paraview.org/download, do one of the following depending on your OS:
* Mac – simply move the ParaView 5.5.0-RC3 application bundle into the trash.
* Linux – simply delete the ParaView-5.5.0-RC3-Qt5-MPI-Linux-64bit directory.
* Windows – Go to the Control Panel and open Add or Remove Programs. Select ParaView-5.5.0-RC3*, then click Uninstall.
Thank you, 5.5 is fantastic! I would love to start using HyperTree grids, but I have found no documentation of the file format, or even file examples. Can you post a link to where I can find more information?
Thanks for the nice comments! If you are bold and have to read it, https://arxiv.org/abs/1702.04852 is a good place to start.
Some hints about the “.htg” format: It is a vtk xml file format, therefore the vtk file format doc is a good place to look first. The most important content for hypertreegrid’s is the topology/”Descriptor” array. It contains a breadth first traversal of the trees in the grid. To get some practice with it make some examples via ParaView’s HyperTreeGrid source and save data. The vtkHyperTreeGridSource doxygen page explains how ‘R’s and ‘.’s make up the Descriptor string.
Thanks for the good work. I installed ParaView 5.5.0 on windows 10 however, I receive this error message whenever I try to launch the application “The code execution cannot proceed because msmpi.dll was not found. Reinstalling the program may fix this problem.” I reinstalled the application but the same error keeps on popping when I try to launch the application. Your suggestions will highly be appreciated towards resolving this challenge, please. Thanks
It seems you have downloaded the MPI version of ParaView for Windows (e.g., ParaView-5.5.0-Qt5-MPI-Windows-64bit.exe), which requires that you install Microsoft’s MPI implementation MS-MPI to run. If you don’t need MPI, you can download the non-MPI version (ParaView-5.5.0-Qt5-Windows-64bit.exe).