ParaView Color Map Editor Improvements
There have been new features added to the color map editor (View -> Color Map Editor) of ParaView. These changes are available in ParaView nightly builds and will be available in ParaView 5.8.0.
Interactive Range Selection
First of all, it is now possible to set a custom range interactively instead of using the usual custom range dialog. Here is how it looks:
The possible interactions are as follows:
- Grab and move a handle inward to reduce the range;
- Grab a handle and move the mouse outward to increase the range (the handle does not move outside);
- Double click on a handle to show the custom range dialog;
- The range is displayed when hovering a handle.
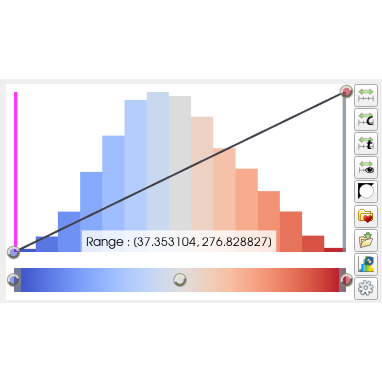
Data Histogram
Secondly, a histogram can now be shown instead of the traditional “color below the curve display”. Just check the checkbox “Display data histogram” to show it.
It can be very useful when interacting with volume rendering representations. Here is how it looks:
- The histogram is always computed on *all* the data, server side, in parallel.
- The histogram is never recomputed automatically, please press the “Recompute Histogram” button when needed. Alternatively, check the “Automatic recomputation” checkbox if it is reasonable for you.
- The reason for recomputing the histogram are:
- Modifying the number of bins;
- Modifying the used lookup table;
- Modifying the range of the lookup table;
- Modifying the data.
These two features will give you a much more dynamic and interactive way to interact with the color map, while changing its range and modifying the opacity transfer function. It became way more easy to identify salient features in a volume, especially when using volume rendering.
This work was supported by Total SA
Developments were done by Kitware SAS, France
Thank you very much for the improvements, especially the histogram as I require such data often.
Again, Thanks
Bob