Point and Smoothed-Particle Hydrodynamics (SPH) Interpolation in ParaView

(This is the second article in a two part series. It shows how to perform point interpolation using ParaView. The first article describes how to perform point interpolation using VTK.)
Introduction
In the first article in this two-part series, we provided background and described the implementation of point interpolation in VTK. Both general point interpolation and smoothed-particle hydrodynamics SPH methods were addressed. In this article, we describe how to use ParaView to perform point interpolation, which of course uses VTK under the hood, but provides a simple and powerful integrated application GUI to perform the interpolation.
The basic procedure is fairly simple. After first reading or creating data with points and associated data attributes (e.g., scalars, vectors, and so on), select Filters->Points Interpolation as illustrated below.
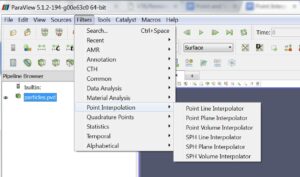
Depending on the type of point data and interpolation process to use (i.e., either generalized or SPH) and whether you want to resample the point data onto a volume, plane or line, six choices are available as shown. Resampling onto a volume means that volume rendering and standard 3D visualization techniques such as isocontouring can be used on the resulting volume. Plane resampling, which along with the associated plane widget, enables the user to rapidly slice through the data and show a heat map on the resulting plane. Finally, plotting along a resampled line supports detailed analysis of data values. Each of these three approaches are shown in the next subsections.
SPH Volume Interpolation
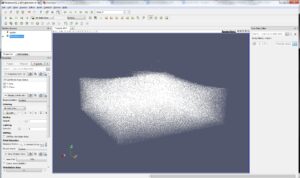
The figure below shows the initial point cloud which is from the VTK test data repository; it’s fairly small in size at only ~175,000 points (SPH_Points.vtu). Note that it is not particularly dense, and the initial visualization is less than compelling as shown.
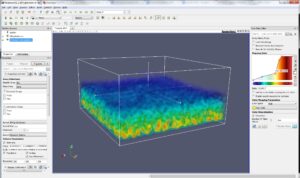
To visualize this cloud with a volume, once read in a SPH Volume Interpolator is created. This brings up an interactive widget which positions a 3D volume into the bounding box of the point cloud (and which can be adjusted as desired). It’s very important to set the correct spatial step size as this smoothing length is central to the spline formulation of the SPH interpolating kernel. Also you’ll want to specify the density array, and volume resolution. You can also optionally select a different kernel than the default quintic formulation, and select with arrays to interpolate (or not). The dimension of the data is 3, as this is space in which the points are located. Note that a custom color transfer function has been created for the rendered image below.
SPH Plane Interpolation
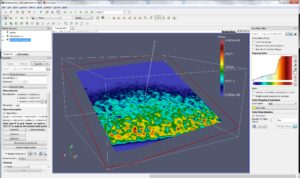
Interpolating across a plane is equally easy. Simply select SPH Plane Interpolator, position the plane with the interactive widget, set the spatial step size, resolution and other parameters as before. The result will be similar to what is shown below.
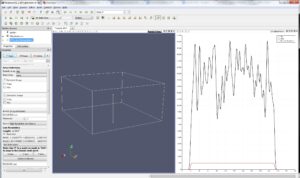
SPH Line Interpolation
The line interpolation process is similar to the plane and volume interpolation process described previously. The biggest difference is that it produces an x-y plot of the various interpolated data attributes. Here the density variable Rho, pressure Press, and Shepard Summation are plotted. Note that in the SPH formulation, the Shepard (or interpolating) coefficients when summed should be approximately equal to one. However near the boundary the coefficient summation falls towards zero.
Conclusion
Interpolating data from discrete data points to one or more sampled positions is a core visualization operation. While VTK and ParaView provide a wealth of interpolation functions as embodied in vtkCells and its subclasses, this process requires an explicit topological articulation to interpolate data. Alternatively, interpolation directly from neighborhood points is possible. Such situations occur when processing point clouds, or when alternative formulations different than that provided by standard cell functions is required. VTK, and the application ParaView now provide fast and flexible tools for interpolating point data. Not only are generalized interpolation processes using specification of various kernels possible, but advanced methods based on spline formulations of smoothed-particle hydrodynamics SPH are too. Further ParaView provides a simple, interactive user interface to sample point data and produce compelling visualizations in 1-, 2-, and 3-dimensions.
Where can I get this “SPH_Points.vtu”? A google search indicates that it exists somewhere, but none of the VTK test data repositories seem to contain this file.
If you have a VTK build directory it will be in “build directory/ExternalData/Testing/Data/SPH_Points.vtu”
If you have downloaded the VTK data files, it will be named “.ExternalData/7deaa4d5dacd9ad40baab8e8c7ce200f”, which you will need to rename.