Real-Time Insight with ParaView Catalyst: A Hands-On Guide Part 1: The Basics

High-performance simulations generate massive datasets—but extracting insight from that data shouldn’t be a bottleneck. ParaView Catalyst integrates analysis and visualization directly into the simulation workflow, delivering in situ processing that eliminates the need for slow, storage-heavy post-processing. The result? You get immediate feedback, streamlined workflows, and new opportunities to steer simulations on the fly.
Built on top of the robust and scalable ParaView architecture, Catalyst minimizes the I/O burden traditionally associated with large simulations. Whether you’re working at your desk or deploying on a massive HPC system, Catalyst adapts to your needs with a flexible, extensible design compatible with a wide variety of simulation codes and computing environments.
This is the first in a series of blogs on designing custom ParaView Catalyst workflows. We will demonstrate how to connect these workflows to simulations instrumented with Catalyst and Conduit. Our example will be based on LULESH, a well-known mini-app that simulates shock hydrodynamics in high-energy physics.
In this article, we’ll walk through how to write a basic ParaView Catalyst script and explain how it connects to instrumented code.
What is Catalyst?
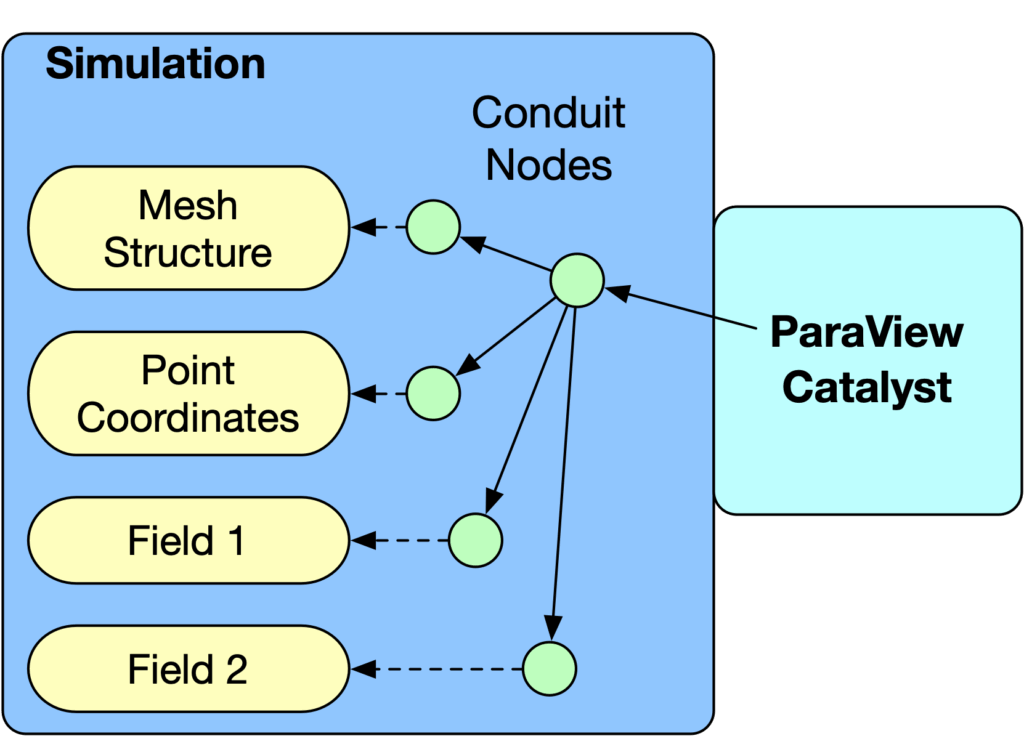
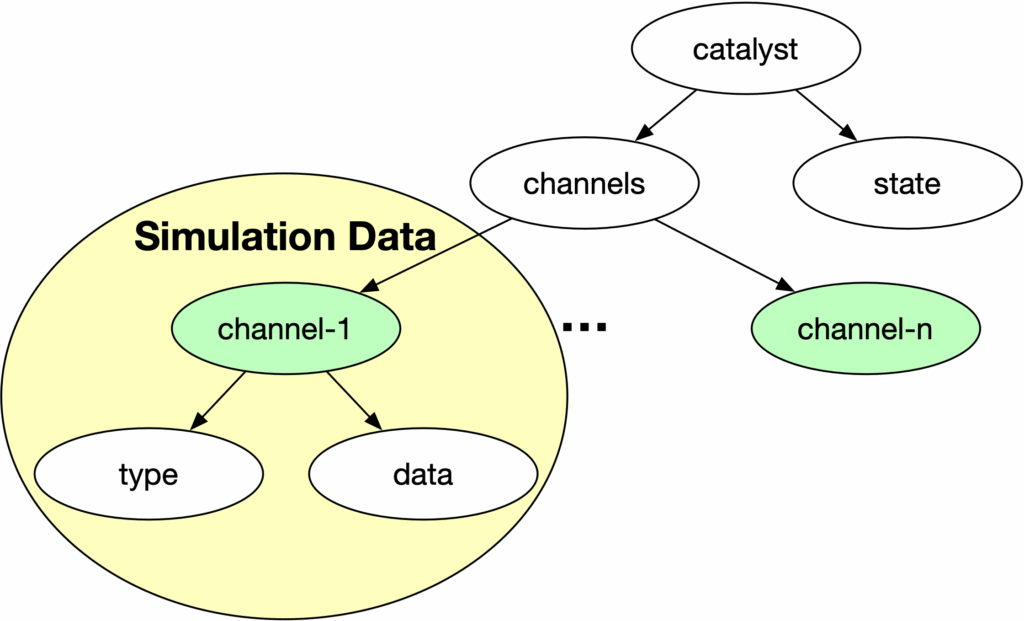
At its core, ParaView Catalyst acts as a bridge between your simulation and the ParaView visualization engine. It uses Conduit, a lightweight schema for describing simulation data in a hierarchical, zero-copy format that enables fast, in-memory sharing of data.
Part of the Conduit graph will contain the following structure:
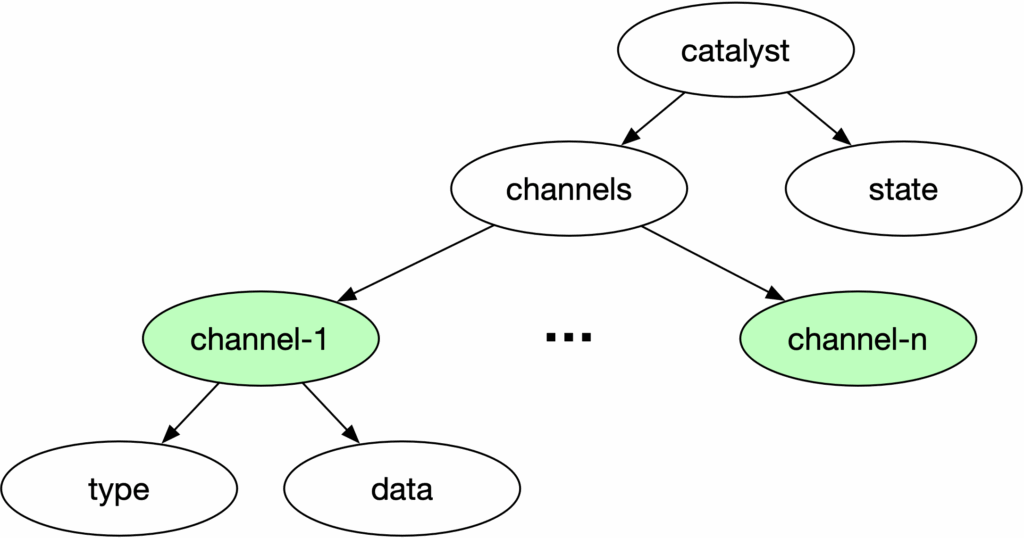
The channels node in Conduit is crucial. Each channel holds simulation data that ParaView can use as a data source, provided the source’s registration name in the script aligns with the channel name. This enables your Catalyst script to directly access simulation data, eliminating the need for duplication. We typically use a TrivialProducer as a placeholder for the actual source that ParaView Catalyst will generate.
In a Catalyst script, a file reader whose registration name matches a channel name is processed identically to TrivialProducers, particularly scripts exported using ParaView. ParaView Catalyst will automatically substitute these readers with suitable Catalyst-compatible sources.
Before writing a Catalyst script, you’ll need a few key details about your simulation’s data:
- Channel names exposed via Conduit
- Geometry type (e.g., structured, unstructured)
- Nodal field names and their representation (scalar, vector, etc..)
- Cell-based field names and their representation (scalar, vector, etc..)
Let’s look at an example.
Case Study: Instrumented LULESH Simulation
We’ll be using an instrumented version of LULESH (Livermore Unstructured Lagrangian Explicit Shock Hydrodynamics) , a mini-app that represents the simulation of a shock hydrodynamics on structured meshes. Here’s the data Catalyst exposes from our instrumented LULESH run:
| Number of Channels | 1 | |
| Channel 1 Name | grid | |
| Geometry Representation | Structural Grid | |
| Nodal Data | scalar | Nodal Mass (nodalMass) |
| vector | Velocity (velocity) | |
| Acceleration (acceleration) | ||
| Force (force) | ||
| Cell-based Data | scalar | Energy (e) |
| Pressure (p) | ||
| Artificial Viscosity (q) | ||
| Relative Volume (v) | ||
Writing Your First Catalyst Script
Here’s a simple Catalyst script that connects to the simulation and prints out data at each timestep.
from paraview.simple import *
from paraview import catalyst
# Let the user know that this script is being used by catalyst
print("executing catalyst_pipeline")
# registrationName must match the channel name used in the
# instrumented LULESH.
producer = TrivialProducer(registrationName="grid")
# Catalyst options
options = catalyst.Options()
options.GlobalTrigger.Frequency = 1

def catalyst_execute(info):
    global producer
    producer.UpdatePipeline()
    # collect everything in a single string
    msg = "-----------------------------------\n"
    msg += f"executing (cycle={info.cycle}, time={info.time})\n"
    msg += "bounds:" +  str(producer.GetDataInformation().GetBounds()) + "\n"
    msg += "velocity-magnitude-range:" + str(producer.PointData["velocity"].GetRange(-1)) + "\n"
    msg += "force-range:"+ str(producer.PointData["force"].GetRange(-1)) + "\n"
    msg += "artificial viscosity-range:"+ str(producer.CellData["q"].GetRange(0)) + "\n"
    # now print it
    print(msg)
What it does:
- Sets up a Trivial Producer for the grid channel.
- Specifies a trigger frequency of one (every timestep).
- Logs the geometric bounds
- Logs data ranges for velocity, force, and artificial viscosity.
The script defines a function named `catalyst_execute`. This specific naming convention is crucial because ParaView Catalyst automatically invokes this function when the instrumented simulation calls the `catalyst_execute` function, which is part of the Catalyst library and is called at the completion of a time-step .
Note: Because we are explicitly printing out information from the producer each time the simulation calls Catalyst’s catalyst_execute function, we need to define the catalyst_execute function. In future blog examples it will not be required.
The portion of the script above the function is used for initialization and is called only once.
Example output:
| executing (cycle=5, time=3.5246941760111524e-06) bounds: (0.0, 1.125, 0.0, 1.125, 0.0, 1.125) velocity-magnitude-range: (0.0, 3147.132357796808) force-range: (-3967.022797217731, 3859.9955998899513) artificial viscosity-range: (0.0, 2898892.456063532) cycle = 6, time = 3.832005e-06, dt=3.073109e-07 |
What’s Next?
Future blog posts will focus on writing scripts to save 3D visualizations to disk and rendering images for animation assembly.
Want to Go Deeper?
This guide focused on writing Catalyst scripts by hand, but there’s much more you can do:
- Want to instrument your own simulation to work with Catalyst? Start here.
- Prefer a visual approach? You can use ParaView’s GUI to design pipelines and export them as Catalyst scripts—no manual coding required. Learn how here.
ParaView Catalyst isn’t just about saving time—it’s about making better decisions, faster. Whether you’re monitoring early results or guiding your simulation interactively, Catalyst helps you stay in control.
Ready to integrate Catalyst into your simulation workflow? Let’s get started.