Real-Time Insight with ParaView Catalyst: A Hands-On Guide Part 2: Saving 3D Visualizations

High-performance simulations generate massive datasets—but extracting insight from that data shouldn’t be a bottleneck. ParaView Catalyst integrates analysis and visualization directly into the simulation workflow, delivering in situ processing that eliminates the need for slow, storage-heavy post-processing. The result? You get immediate feedback, streamlined workflows, and new opportunities to steer simulations on the fly.
Built on top of the robust and scalable ParaView architecture, Catalyst minimizes the I/O burden traditionally associated with simulation runs. Whether you’re working at your desk or deploying on a large HPC system, Catalyst adapts to your needs with a flexible, extensible design compatible with a wide variety of simulation codes and computing environments.
This is the second in a series of blogs on writing ParaView Catalyst scripts. You can find the previous article where we demonstrate how to create a simple ParaView Catalyst script using a Catalyst instrumented version of LULESH, a well-known mini-app that simulates shock hydrodynamics in high-energy physics here.
In this article, we will be writing scripts that produce post-process files that can be read into ParaView.
Creating a Simple Extract Pipeline
The script developed in the previous article can be useful to understand the ranges of values that a simulation can produce and could be run on a coarse simulation. Let’s take it one step further. Instead of just printing stats, let’s write out data for each timestep using a VTPD (VTK Partitioned Dataset) extractor:
from paraview.simple import *
from paraview import catalyst
# Pipeline
producer = TrivialProducer(registrationName="grid")
extractor = CreateExtractor('VTPD', producer)

# Catalyst options
options = catalyst.Options()
options.ExtractsOutputDirectory = "./datasets/"
options.GlobalTrigger.Frequency = 1
In this example, We have constructed a simple pipeline where the Trivial Producer is connected to an extractor. This extractor will generate VTK Partitioned DataSets (VTPD) files for each simulation timestep, saving them in a directory named datasets.
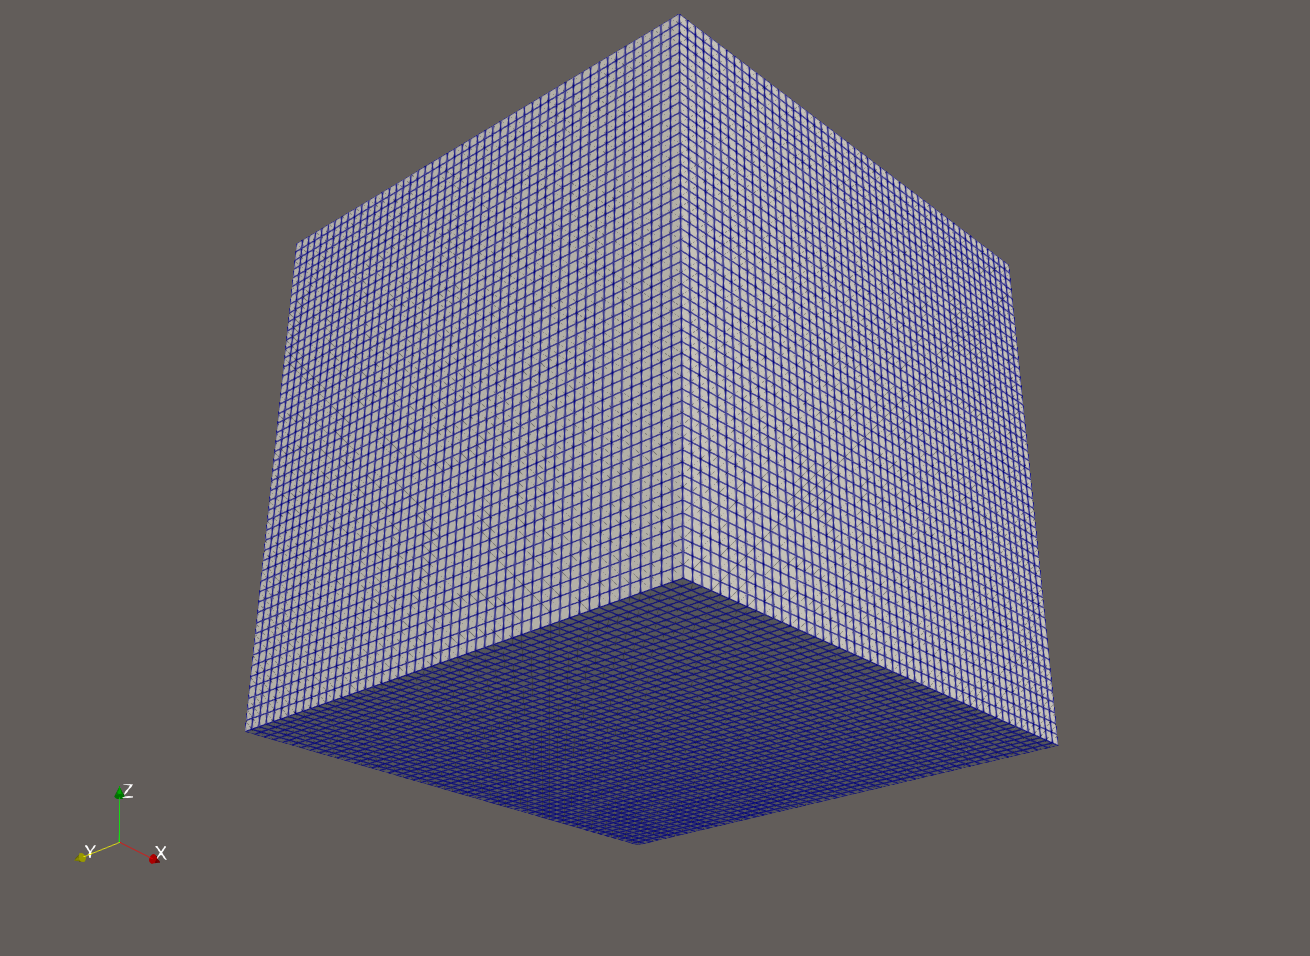
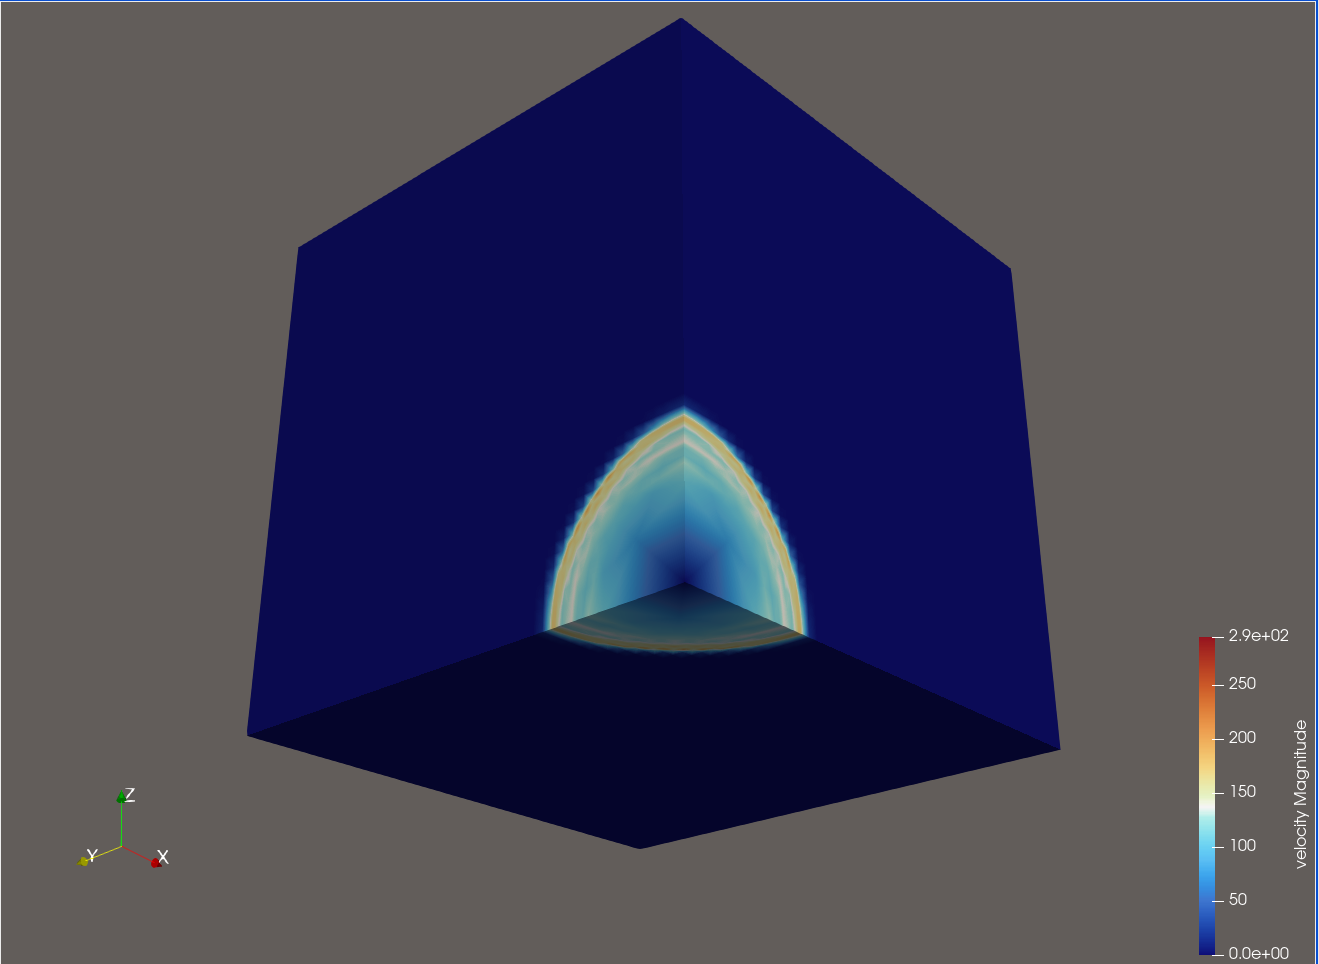
Extractors are pipeline components that resemble writers. Like filters, they accept inputs. However, unlike sources or filters, they do not produce output for other pipeline components. Instead, when activated, extractors create files, known as extracts. These extracts can then be imported into ParaView for subsequent analysis as shown below.
 |  |
Saving Contour Visualizations
Want to generate only specific visual representations, like isosurfaces of force magnitude? Try this:
from paraview.simple import *
# Catalyst options
from paraview import catalyst
options = catalyst.Options()
options.ExtractsOutputDirectory = "./contours"
options.GlobalTrigger.Frequency = 1

producer = TrivialProducer(registrationName='grid')

# create a new 'Contour'
contour1 = Contour(registrationName='Contour1', Input=producer)
contour1.Set(
    ContourBy=['POINTS', 'force_Magnitude'],
    Isosurfaces=[0.0, 33.13563731452242, 66.27127462904484, 99.40691194356725, 132.54254925808968, 165.6781865726121, 198.8138238871345, 231.94946120165693, 265.08509851617936, 298.22073583070176],
)

# create extractor
vTPD1 = CreateExtractor('VTPD', contour1, registrationName='VTPD1')
This script inserts a contour filter before writing the extracted geometry and would produce iso-surfaces based on 10 contours values of the magnitude of the force. When visualized, the contours provide insight into how forces are distributed over time.
As this example demonstrates, creating in-situ visualizations with Catalyst requires minimal effort once the simulation is instrumented. The paraview.simple package offers extensive functionality for your Python scripts. Further details are available here.
What’s Next?
You should now be able to construct ParaView Catalyst scripts that generate post-process geometry. This geometry can then be further processed or visualized using ParaView. The final blog in this series will focus on rendering images for animation assembly.
Want to Go Deeper?
This guide focused on writing Catalyst scripts by hand, but there’s much more you can do:
- Want to learn how to instrument your own simulation to work with Catalyst? Here is a good place to start.
- Prefer a visual approach? You can use ParaView’s GUI to design pipelines and export them as Catalyst scripts—no manual coding required. Learn how to here.
ParaView Catalyst isn’t just about saving time—it’s about making better decisions, faster. Whether you’re monitoring early results or guiding your simulation interactively, Catalyst helps you stay in control, ultimately leading to improved decision-making and accelerated progress.
Need help integrating ParaView Catalyst into your code? Kitware brings decades of expertise in scientific visualization and simulation. Contact our team to discover how we can help you fully leverage ParaView Catalyst.