Recent Improvements to ParaViewWeb: Local Rendering, Property Management, and More

Recently, a lot of effort has gone into web-based projects that Kitware manages, including:
- ParaViewWeb, a JavaScript library that developers can employ to build applications that run on the Web and use the Visualization Toolkit (VTK) or ParaView as the backend;
- vtk.js, a rendering library for high-performance computing; and
- Visualizer, an application that renders and processes data with ParaView.
Even ParaView and VTK have received significant updates to support web-based visualization. We would like to share some of the improvements gained as a result of these efforts: the return of local rendering, the improved handling of proxy properties, and the introduction of wslink.
Return of Local Rendering
Last year, Visualizer was updated to use React and Redux. While the previous jQuery-based version could download geometry to the browser and render it locally using WebGL, the updated version did not include such functionality until now.
In the last year or so, we made such great progress on vtk.js that we felt it was ready to be used as the mechanism for local rendering in ParaViewWeb and friends. So, as of ParaView 5.4 and Visualizer 2.1.0, you can again enable local rendering simply by flipping a switch in the Visualizer settings panel. The switch is even in the same location. While this capability may not suit a massive dataset (as the data needs to fit in browser memory, if you wish to render it there), if your data is small enough, you should see a big gain in perceived rendering speed by using local rendering with vtk.js.
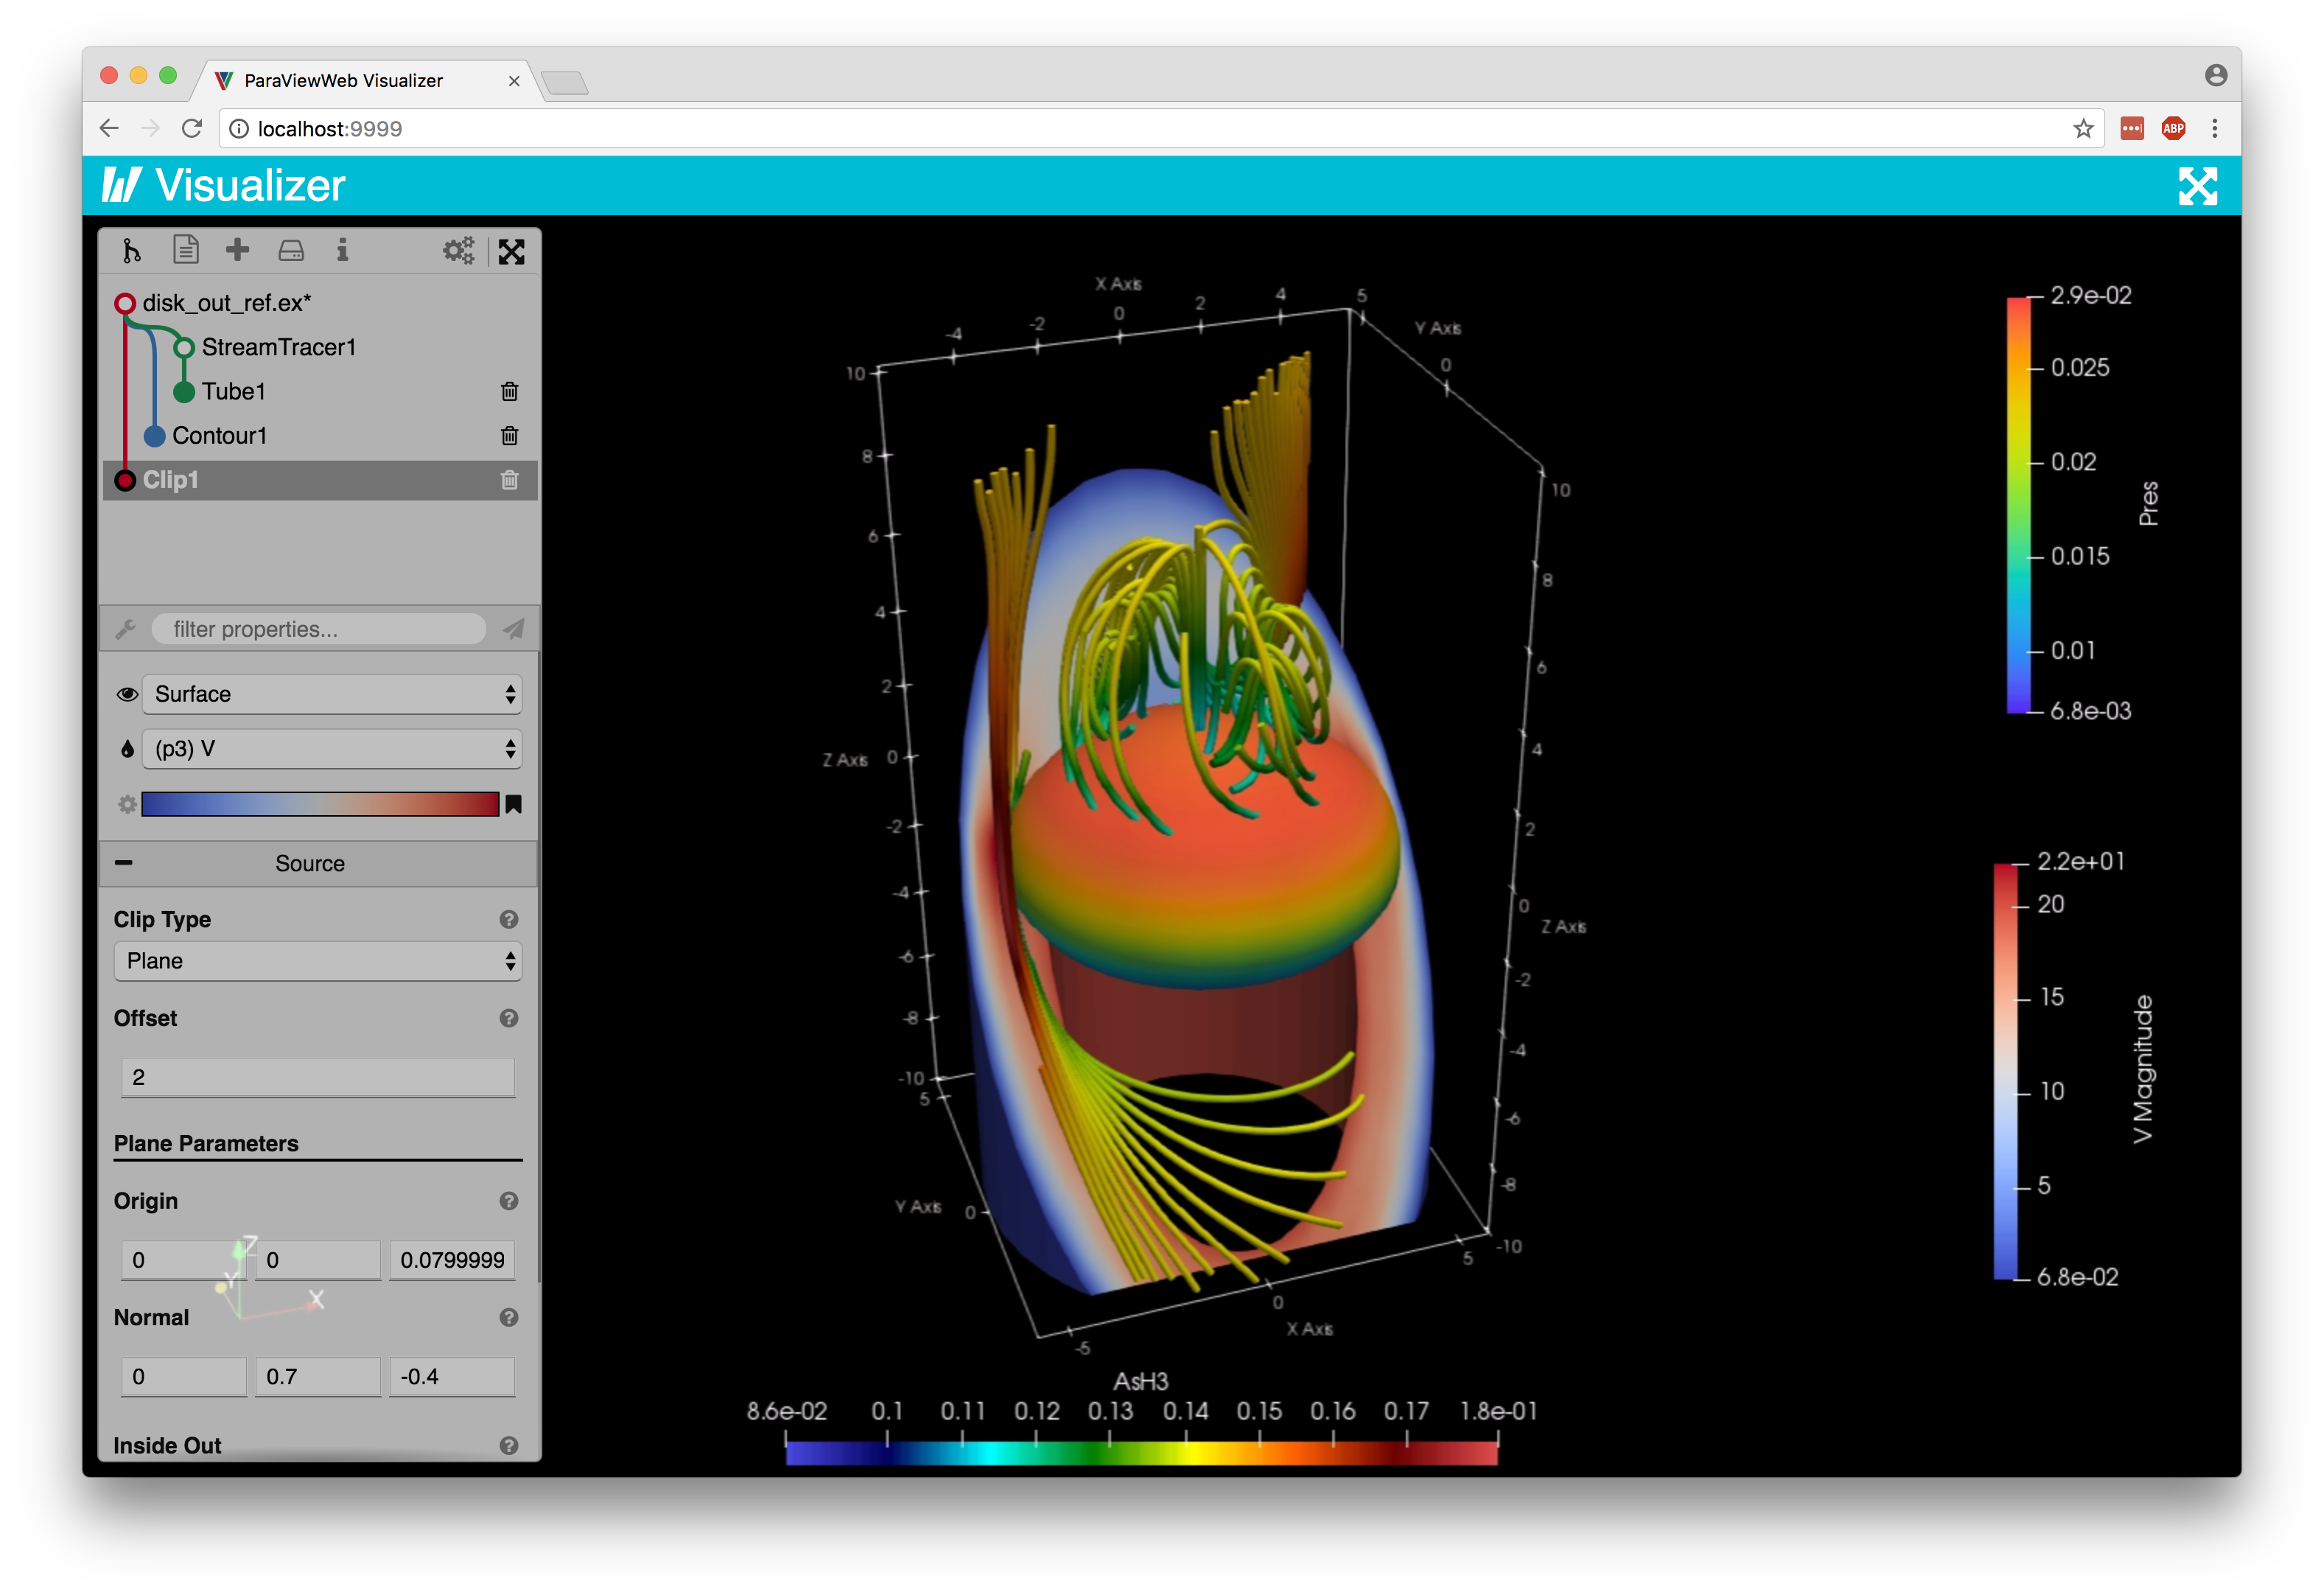
As you can see below, the data can be rendered locally by opening the Settings panel (identified by the cogs icon) and unchecking “Remote Rendering.”
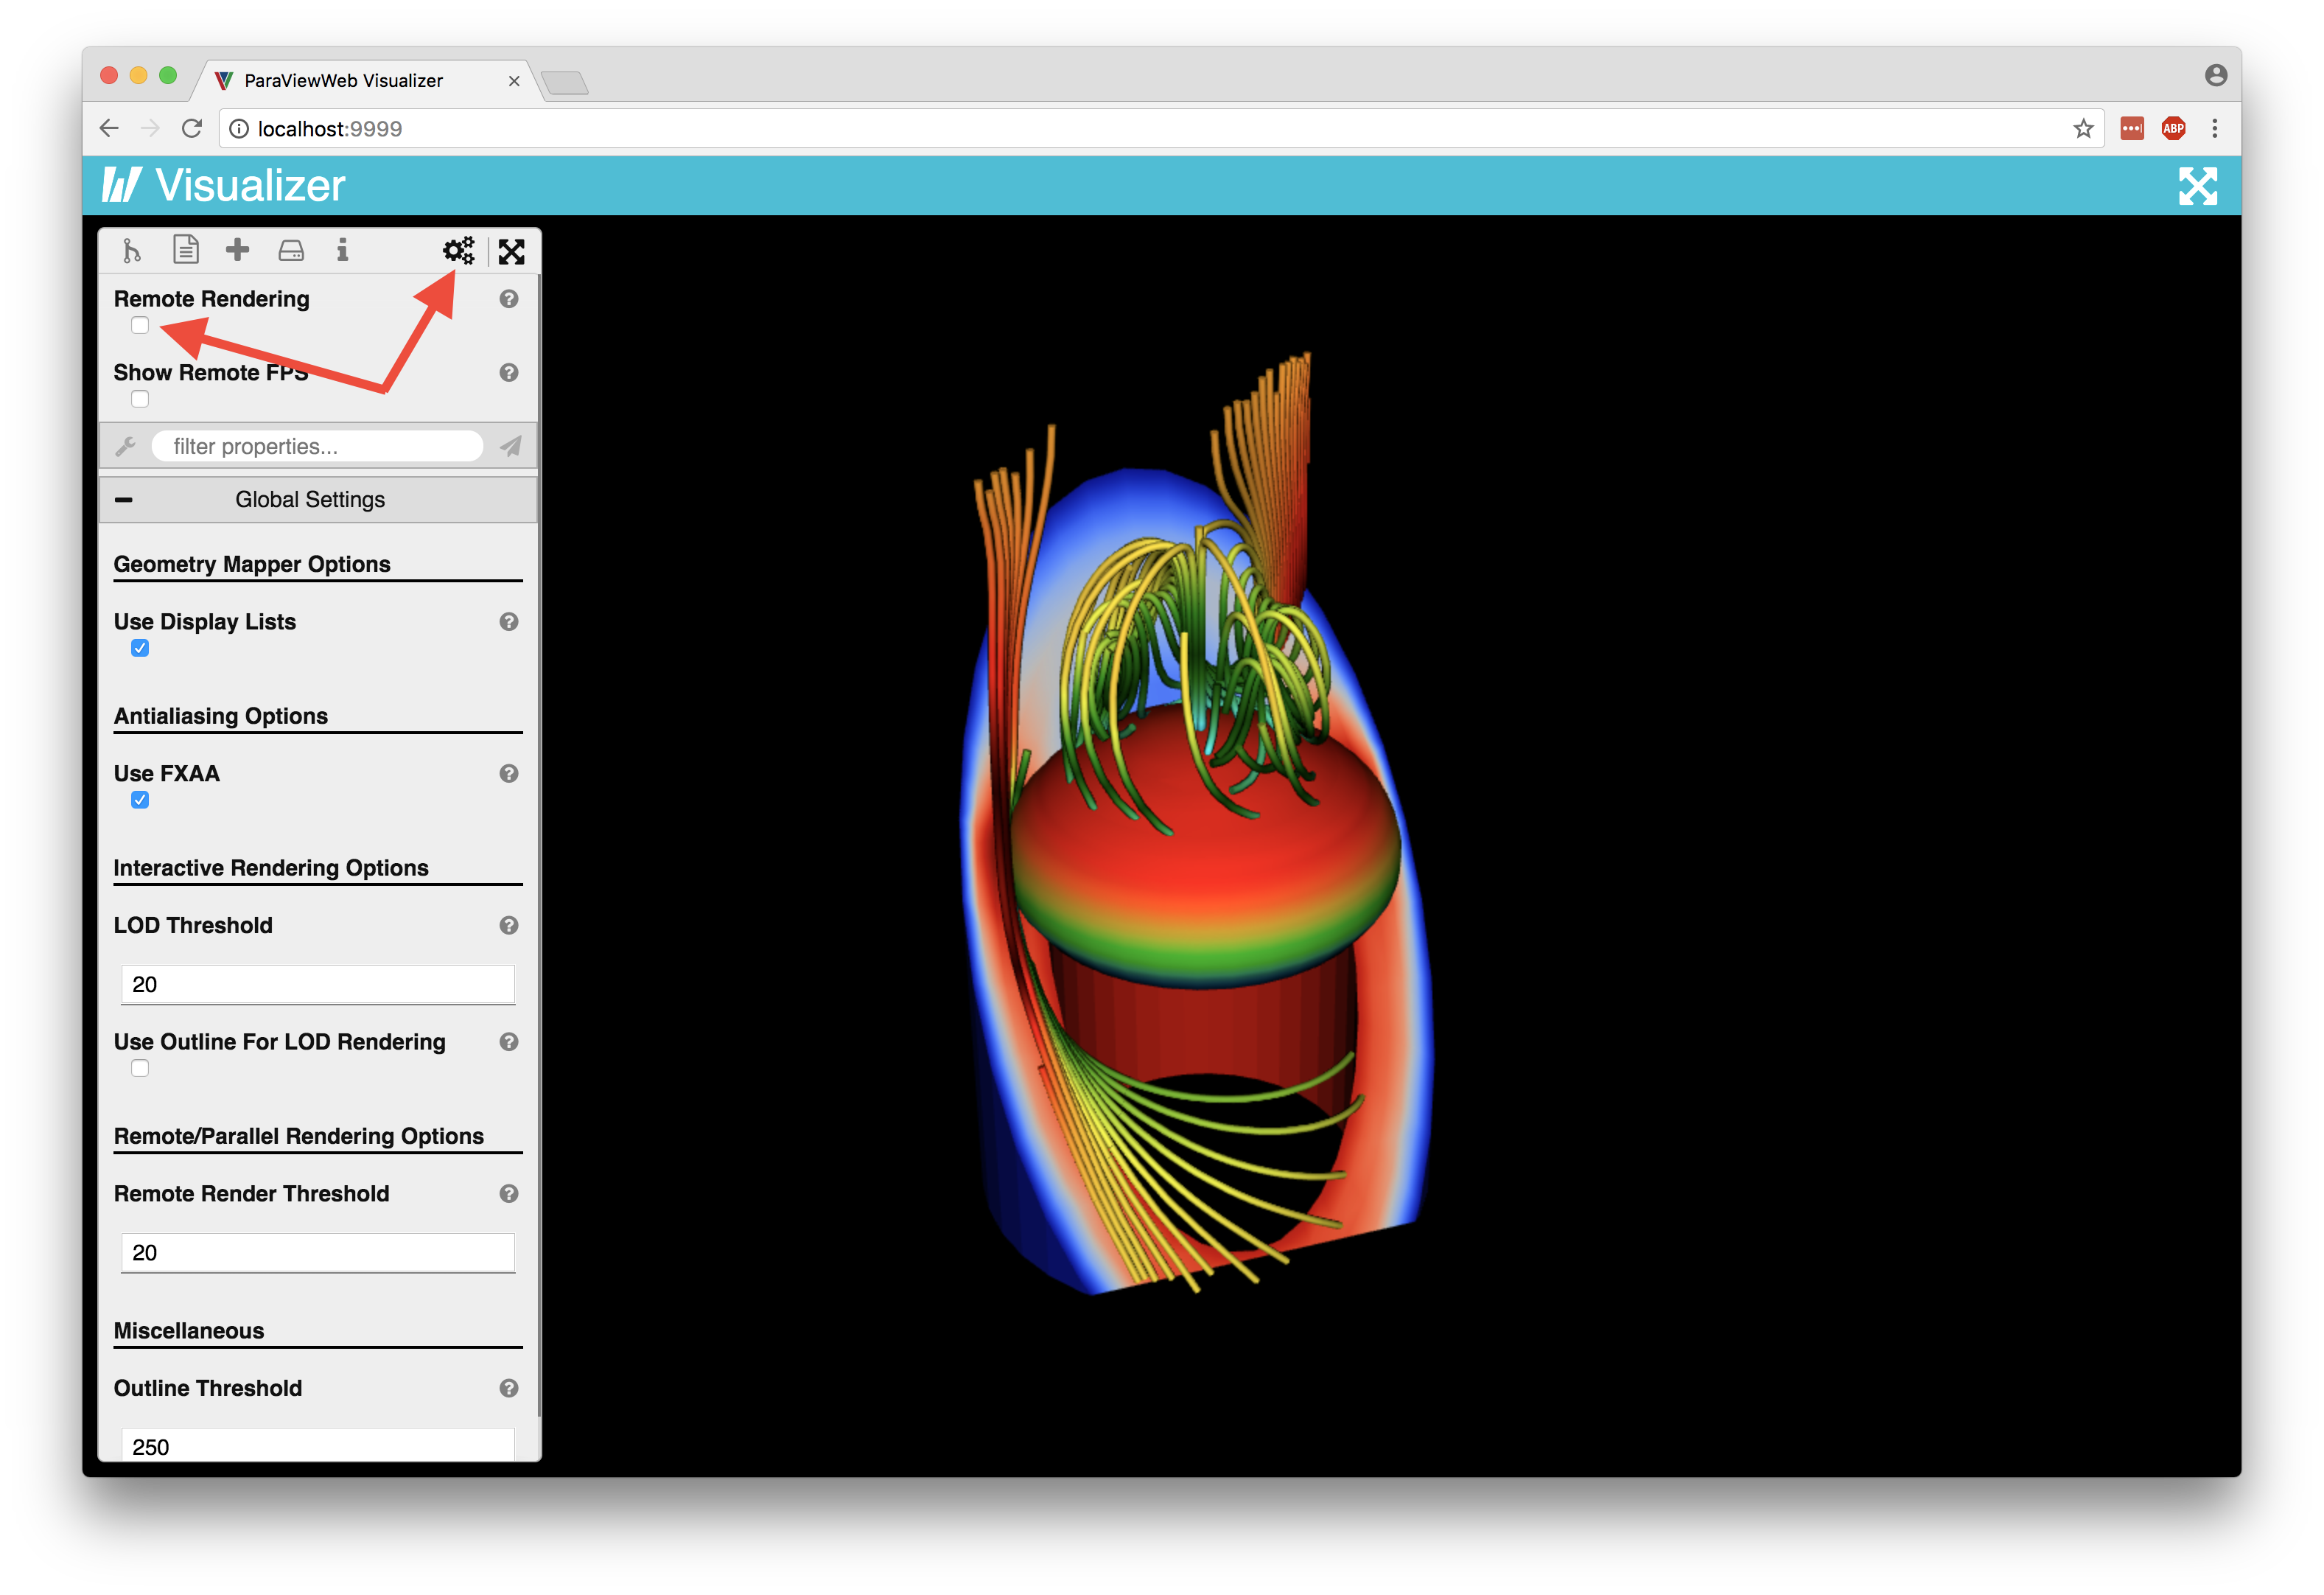
This capability is a work in progress, and not all features from remote rendering are yet available in local rendering, as the above images evidence. The basic functionality, however, is now there. Future work includes things like scalar bars, axes grid, orientation axes, volume rendering, and three-dimensional (3D) widgets.
The new local rendering capability of Visualizer is available as of ParaView 5.4. Just download the 5.4 binary for your operating system, and take it for a spin!
Improved Handling of Proxy Properties
Since exposing the majority of ParaView proxies and properties to the web quite some time ago, the flat properties lists that pertain to sources, representations, and views have grown longer and longer. It had become very difficult to understand the uses of some of the properties, as there were no sections or titles. Even without turning on advanced properties, to find a particular setting, you had to sift through around 200 representation properties. We have recently put some effort into cleaning up the properties lists. As of the June 21, 2017, ParaView master (and Visualizer 2.2.1), we have started to see some nice behavior in the Visualizer property panel.
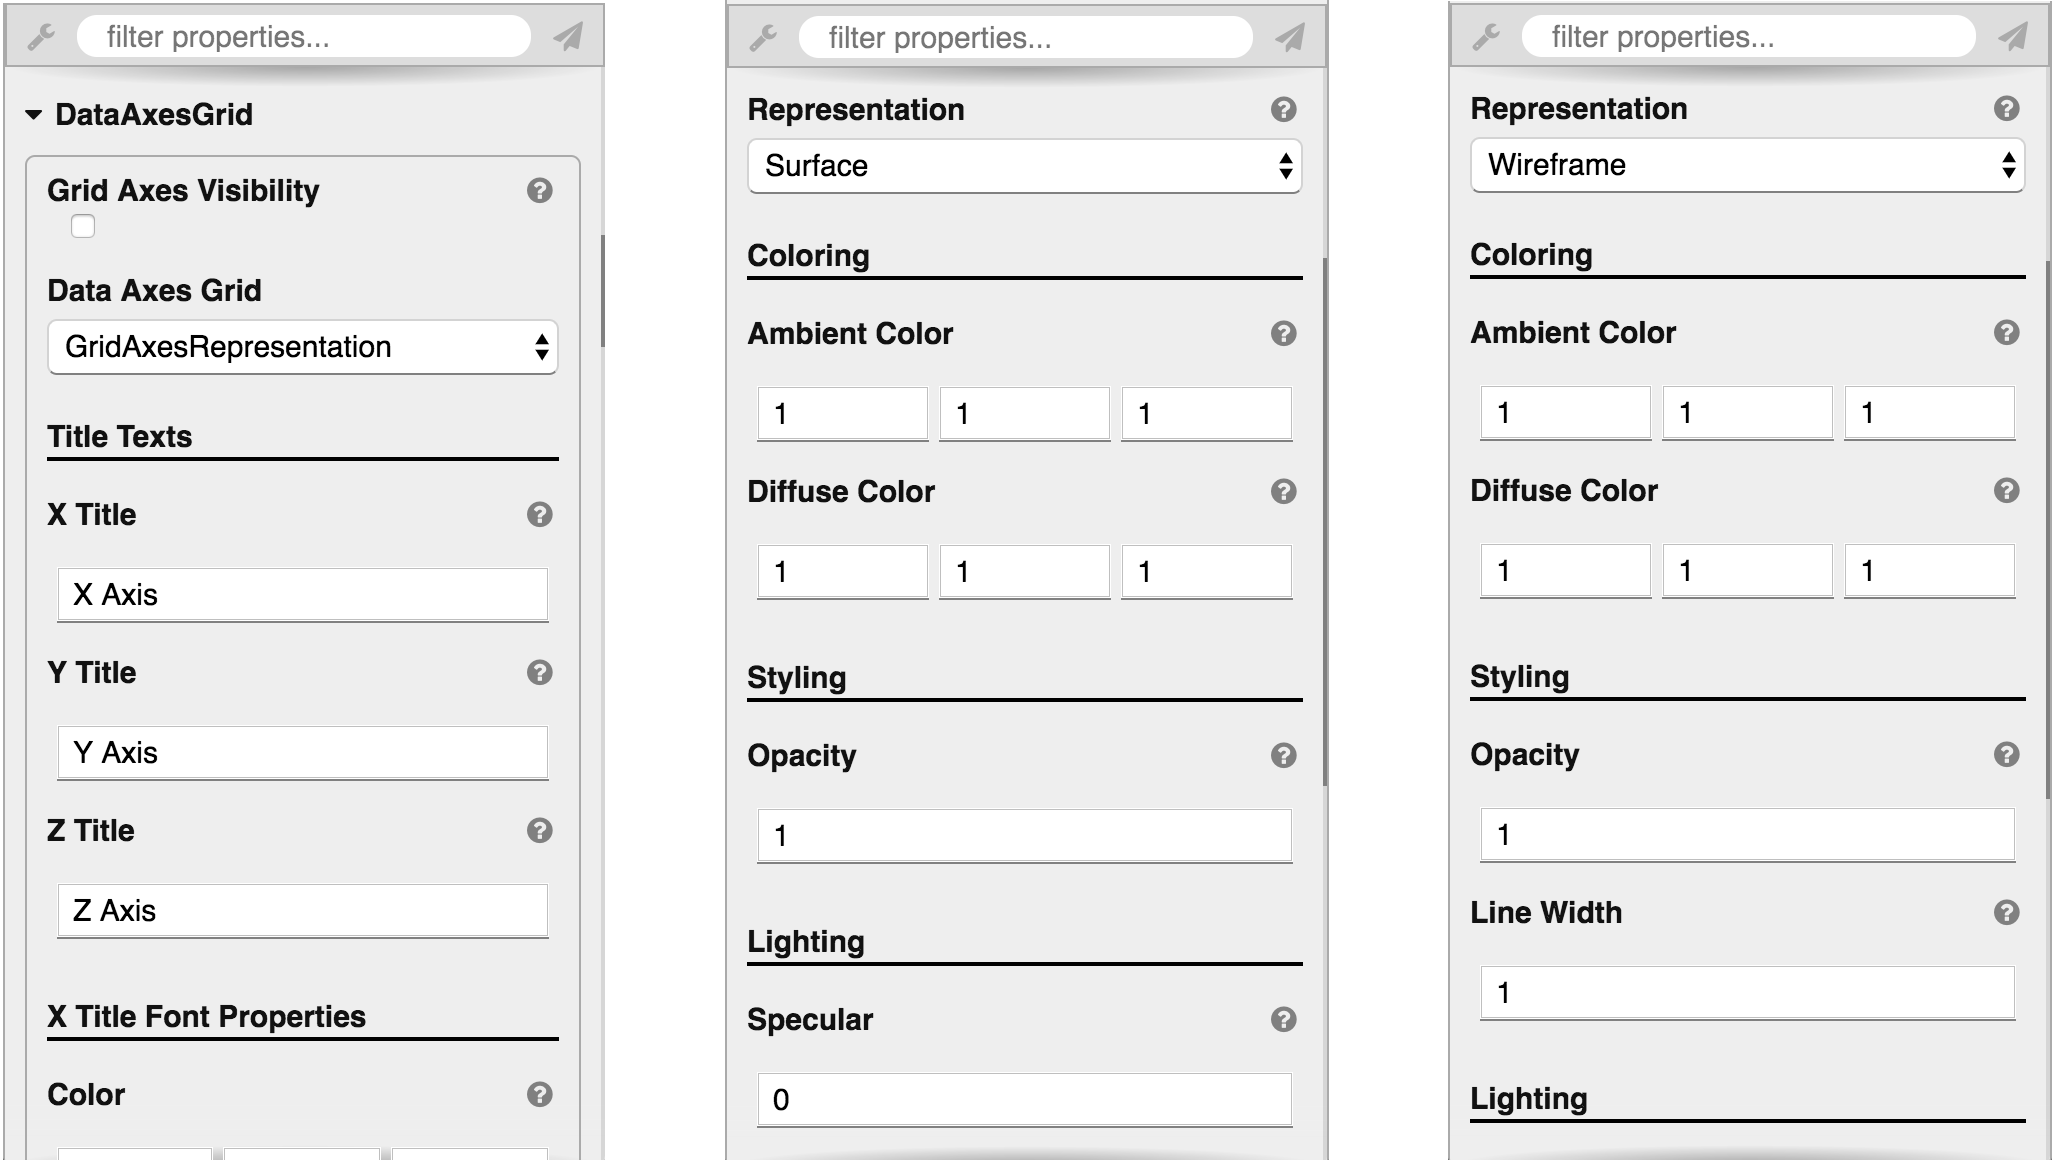
Many of those 200 representation properties belonged to complex proxy properties like Data Axes Grid and Polar Axes Grid (based on the VTK Polar Axes). As is visible in the above images, these properties have been collected into a couple of collapsible groups, so they don’t clutter the panel, unless you need to see them. Additionally, ParaView provides information about how properties should be grouped in the user interface (UI), which we are now using to provide nice labels on groups of properties within the Web Properties panel. You can still expect to see “Color” repeated many times under the representation properties, but each time, it should be grouped under a title that indicates what that particular “Color” property means.
Another change in ParaView allows certain advanced properties to become default, if a specific representation is selected. Visualizer now benefits from this information as well. Just create a cone source, and open the representation properties. Now, under “Styling,” the only default property is “Opacity,” when the representation is set to “Surface.” Change the representation to “Wireframe,” and you should see “Line Width” as a default property, just as you would in ParaView.
The new-and-improved handling of proxy properties is available via the ParaView nightly binary.
Introducing wslink
Another improvement in the works is not one that we can show in a screenshot (because it lives “under the hood”). Nevertheless, it will provide a lot of benefit to Visualizer and ParaViewWeb, as well as other projects down the road. This improvement comes through wslink. wslink allows easy, bi-directional communication between a Python server and a JavaScript client over a websocket. The client can make remote procedure calls (RPC) to the server, and the server can publish messages to topics to which the client can subscribe (pub-sub). The server can include binary attachments in these messages, which are communicated as binary websocket messages to avoid the overhead of encoding and decoding.
ParaViewWeb, ParaView, and VTK are in the process of converting their web interfaces to use wslink. The current releases use Autobahn WAMP for sending messages between a JavaScript client in a web app and a Python server that launches VTK or ParaView visualization processes per user. Unfortunately, the current architecture of Autobahn does not support creating and destroying processes per user, so we have been stuck on an old version.
The conversions to wslink have several features.
- Python 3: We’ve upgraded the web stack to be fully compatible with Python 2 and 3. This required an upgrade to our Twisted webserver, among numerous small compatibility changes.
- Simplified messaging: All our messaging is point-to-point; the web application initiates a connection with the server, which sets up a dedicated websocket link for that client. This means we eliminated the complexity of the broker/router functionality of Autobahn’s crossbar.io.
- Improved performance: We included binary attachments in JSON messages by sending them as a separate binary message. As a result, we eliminated the overhead of encoding.
- Open source: All wslink code is available and free to use for everyone. The two pieces of wslink have very few dependencies, and wslink is independent of its use in ParaViewWeb. This means that it can be used in other web applications.
Because wslink speaks two languages, it has been published separately to the appropriate package managers: npm for the client JavaScript and pypi for the server Python. Integration into VTK, ParaView, and ParaViewWeb is complete, and awaits the next release!
We expect wslink to be fully rolled out in ParaView 5.5 this coming November 2017.
Thanks for writing this great article for us. I have gained good stuff from this website. Looking forward to your next article. I am happy to share this post to my friends. Keep it up.