New segmentation and analysis features coming to Tomviz

New features added to Tomviz enhance support for the computation and viewing of segmentation and analysis algorithm results.
Segmentation Algorithms Available
Tomviz 0.9.1 offers some basic segmentation algorithms to apply to data. Each segmentation algorithm produces a “label map” which is a labeling of each voxel in the current dataset.
The “Binary Threshold” data transform computes a label map with values 0 and 1. Voxels with values between lower and upper threshold values are assigned the value 1 while other values are assigned the value 0.
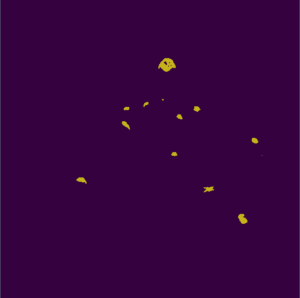
Binary segmentation: segmented nanoparticles are shown in yellow.
The “Connected Components” similarly classifies voxel values within a lower and upper threshold range, but it assigns a unique label to each connected component in the threshold result. The unique labels are assigned so that the largest connected component has the highest label value while the smallest component has the lowest label value.
 Connected components: different connected components are uniquely labeled and colored.
Changes coming to the next release of Tomviz make viewing these segmentation results much more intuitive.
Reporting Analysis Results
Data Transforms in Tomviz can now produce additional output data. Examples include child datasets, or separate image data sets produced during the data transform operation. This feature can be useful for situations where you want to preserve the original dataset for viewing, which may be the case with data transforms that produce image reconstructions or for segmentation transforms that produce label maps.
Both the “Binary Threshold” and “Connected Components” data transforms now produce a label map data object separate from the data set being transformed. This separate dataset may be further transformed by additional data transforms that operate only on the child data set while leaving the original dataset values alone.
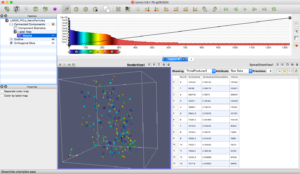
In addition, data transforms can now produce additional result data objects containing arbitrary data. For example, the “Connected Components” data transform produces a table result that contains information about each component’s surface area, volume, and surface-area-to-volume ratios. Table results like these can be viewed in Tomviz’ spreadsheet view as shown below.
What’s Next
The “Binary Threshold” and “Connected Components” data transforms are among the simplest segmentation algorithms that exist. We plan to add additional segmentation algorithms including watershed-based algorithms, region-growing algorithms, and pore analysis algorithms in future versions of Tomviz. In fact, with Tomviz’ integration of the Insight Segmentation and Registration Toolkit (ITK) via ITK’s Python language bindings, any algorithm available in ITK is available for use in Tomviz.