Using VTK to Represent HPC Simulations with SST/Macro

The Structural Simulation Toolkit (SST) is a framework for building simulations by incorporating a variety of existing packages including processor, memory, disk, network, and software models [1]. SST/macro is a branch of SST which is aimed exclusively at coarse-grain, macro-scale, and efficient system-level simulations, and has previously been described and used in high performance computing-related studies [2], [3]. It is an open source project that can be accessed from http://sst.sandia.gov.
Here we present visualizations of SST/macro using VTK. First, we introduce SST/macro and related components. Second, we present how fixed-time quanta (FTQ) can be used to visualize simulation time spent on CPU versus MPI using various VTK chart capabilities. Third, we show how SST/macro uses VTK to render 3D visualizations of network topologies.
SST/Macro
SST/macro is a modular discrete event simulator (DES) where each simulated process runs on its own user space thread with its own stack and local frame of execution, which enables online simulation of real application code. These lightweight threads don’t advance simulated time until they make calls into libraries, such as MPI. Libraries can register events and perform actions through a well-defined interface that accesses the hardware models and DES. Visualizations with VTK are tied to events that occur at a low level, just before registering with the DES, to capture broad categories of behavior in hardware and software.
SST/macro has implementations of software libraries and runtimes such as MPI, sockets, HPX, and OpenSHMEM, allowing us to consider a variety of application execution paradigms. SST/macro also has a variety of hardware models for varying degrees of trading accuracy for simulation efficiency, along with realistic implementations of protocols like MPI rendezvous using RDMA. Considering the potentially complex interactions of hardware and software models, it is often useful to turn to visualizations to make sense of simulation results.
Fixed-Time Quanta (FTQ)
Of primary interest is recording how much time a process spends computing, communicating (MPI), accessing memory, or any other type of relevant event. A simple, but still powerful tool for visualizing application performance is a fixed-time quanta (FTQ) chart that records the amount of work done in discrete time units. The application runtime can be broken into several discrete chunks (time quanta). In SST/macro, we label these time quanta as “epochs.” An application that runs for 1s might be broken into 1000 epochs of 1 ms. The amount of work done in each interval is recorded and graphed as 1000 discrete lines. Time advances for each process every time it blocks/unblocks. Upon unblocking, SST/macro compares the previous and the current timestamps, giving the total time elapsed on a given operation. FTQ data is collected every time a process (user-thread) unblocks. Each unblock is tagged by the event type – usually as computation or communication.
There are several event types in the course of the simulation; common events are computation and communication, i.e. message passing interface (MPI) events. Other events include sleep or memory reads. Our focus is time spent on computation (or CPU) and MPI. We are interested in when and how much time is spent on these two events. To visualize this, we can create several charts. The main chart in Figure 1 shows time spent on CPU versus MPI in all the threads in the simulation. The vertical axis is the thread ids and the horizontal axis is the time elapsed during simulation. The red “X” indicates CPU time and a green dot indicates MPI time. This chart can be useful in showing the synchronous nature of applications, often indicating large bursts of communication. Optional charts such as those in Figure 2 are created for detailed per-thread visualization. These can be created either one thread per window or up to 9 threads per window, and are often useful for showing a rough estimate of the utilization of each thread.
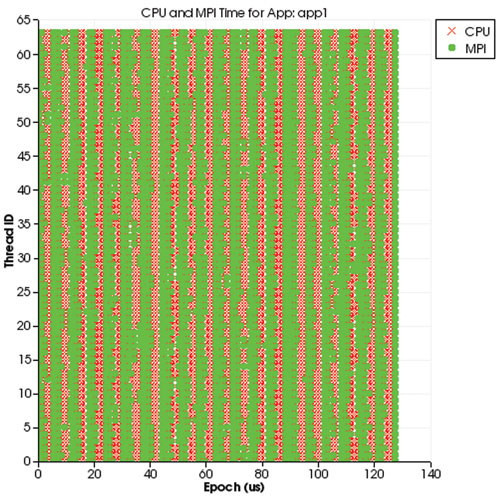 Figure 1: Time spent on CPU vs MPI in all the threads in the simulation.
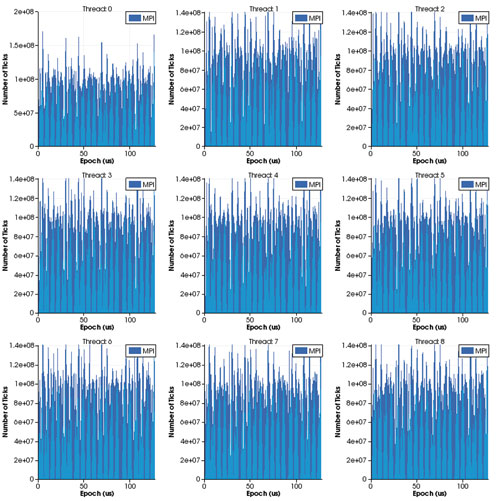 Figure 2: Time spent on CPU vs MPI per thread
All of these are interactive charts that users can zoom in or out and move using the mouse. There are three different chart types that can be selected for the thread chart: bar (default), line, and area. There is also an option to display the chart(s) as simulation progresses, or you may wait until the end of the simulation to display the final charts. To build SST/macro with visualization capabilities, first install VTK and then set VTK_LD_PATH and VTK_INC_PATH environment variables. Lastly “–enable-vtk” flag is needed when configuring SST/macro. This feature is available from version 2.4.0 and can be downloaded from https://bitbucket.org/ghendry/sstmacro/downloads.
The following shows the additional parameters needed in the configuration file:
logger_params = <stats> ftq
ftq_num_epochs = 1000000
ftq_epoch = 280ms
ftq_min_time = 100ns
ftq_vis_show = true
# false by default. Shows the main chart with all
# the thread index on left (vertical axis) and
# epoch on bottom (horizontal axis).
ftq_vis_show_thread_chart = true
# Whether to show per thread chart (default: false)
ftq_vis_show_thread_chart_separate = false
# Whether to show per thead chart on separate window
ftq_vis_show_thread_chart_type = bar
# Per thread chart type. Options are bar, line, area
ftq_vis_show_summary_chart = false
# Whether to show updates to each chart (by default)
# as simulation progresses
3D Network Topology Visualization
Using VTK, SST/macro can also produce a visualization of activity on compute nodes arranged according to the network topology. Figure 3 shows a snapshot of a particle-in-cell simulation running on a 3D torus network topology. Boxes represent network switches and light up in different colors according to the amount of bandwidth going through them. Similarly, network links between switches are also colored the same way according to the load on each link. SST/macro visualization is modular, with each network topology programmed to know how to display itself. However, for higher-dimension topologies like a 7D torus or dragonfly, it can become difficult to make sense of the view in an online visualization, so playback with ParaView is recommended. Being able to view activity across the system in this way allows a user or system designer to potentially identify critical paths or bottlenecks in the network, enabling the development of more suitable network topologies and routing algorithms, better application mapping strategies, or algorithms that use asynchronous communication.
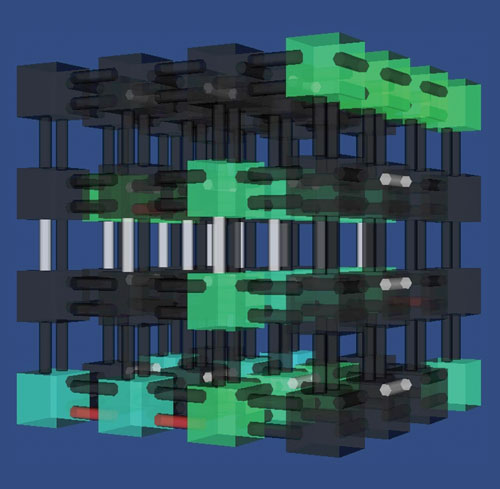 Figure 3: 3D Network Topology
Acknowledgement
Sandia National Laboratories is a multi-program laboratory managed and operated by Sandia Corporation, a wholly owned subsidiary of Lockheed Martin Corporation, for the U.S. Department of Energy’s National Nuclear Security Administration under contract DE-AC04-94AL85000.
 Yung Ryn (Elisha) Choe is a senior member of technical staff at Sandia National Laboratories in Livermore, California. He received his PhD in Electrical and Computer Engineering from Purdue University in 2007. His research interests include large-scale distributed computing, cloud computing, computer and network security, storage server for Video-on-Demand (VoD), embedded systems, and development tools.
 Jeremiah Wilke has been a senior member of technical staff at Sandia National Laboratories since 2012. He received his PhD in computational chemistry from the University of Georgia in 2011 and his B.S. in Biochemistry and Mathematics from the University of Wisconsin-Madison in 2006. His primary research interests include simulation of high-performance computing systems, fault-tolerant programming models, and extreme-scale implementations of molecular electronic structure theory.
 Gilbert Hendry received a B.S. and M.S. in Computer Engineering from the Rochester Institute of Technology, and a PhD in Electrical Engineering from Columbia University. His dissertation focused on network design involving silicon nanophotonics for network-on-chip applications, as well as design automation techniques and software development in this area. He is currently a staff member in the Scalable Modeling and Analysis Systems group at Sandia National Laboratories in Livermore, CA, and is the PI and technical lead for the SST/macro simulator project. Gilbert has over 20 publications in conferences and journals in the area of computer architecture and network simulation.
References
- A. F. Rodrigues, K. S. Hemmert, B. W. Barrett, C. Kersey, R. Oldfield, M. Weston, R. Risen, J. Cook, P. Rosenfeld, E. CooperBalls, and B. Jacob, “The structural simulation toolkit,” SIGMETRICS Perform. Eval. Rev., vol. 38, pp. 37–42, March 2011.
- C. L. Janssen et al., “A simulator for large-scale parallel computer architectures.” IJDST, vol. 1, no. 2, pp. 57–73, 2010.
- C. L. Janssen et al., “Using simulation to design extremescale applications and architectures: programming model exploration,” SIGMETRICS Perform. Eval. Rev.,vol. 38, pp. 4–8, March 2011.