Visualization of CTest Test Times

For effective software development, the edit-compile-test cycle should run quickly. In order to get a better understanding of ITK‘s test times, we created a Python script that visualizes CTest test times with VTK‘s TreeMapView.
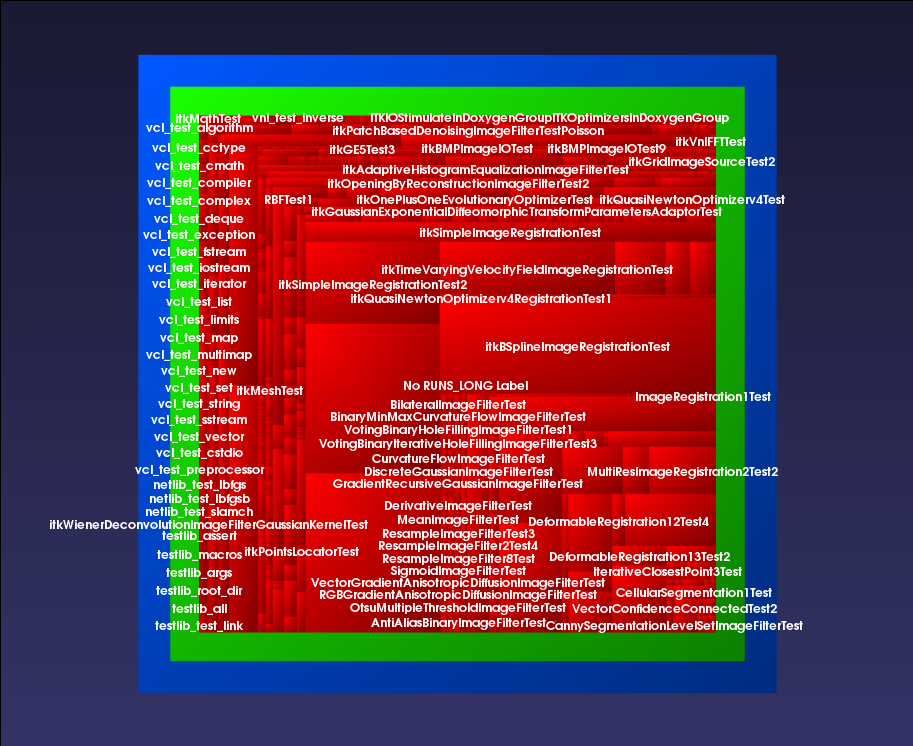
ITK test times.
Tests that run longer have a proportionally larger area. With the visualization, it is clear that there are some tests that take significantly longer than most others. It is possible to zoom in and zoom out on tests and identify their names with a mouse hover or click.
After identifying the long running tests, we added a CTest label to them.
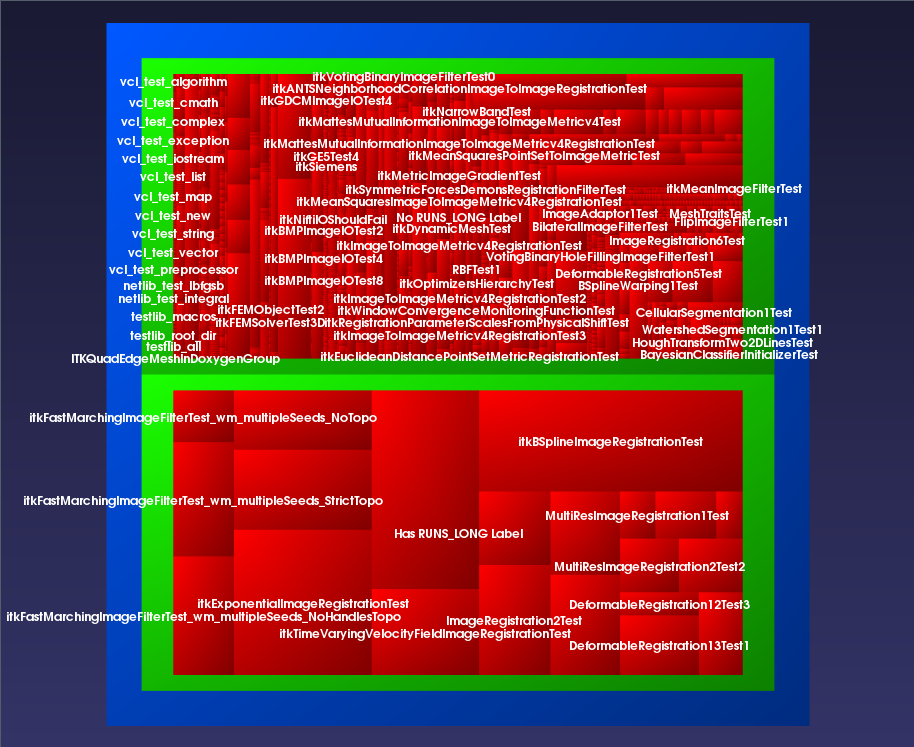 ITK tests without RUNS_LONG label (top) and with RUNS_LONG label (bottom).
Tests with the RUNS_LONG label constituted less than 1% of the tests, but they take approximately half of the time to run the test suite!
It is possible to also organize the visualization by ITK module label.
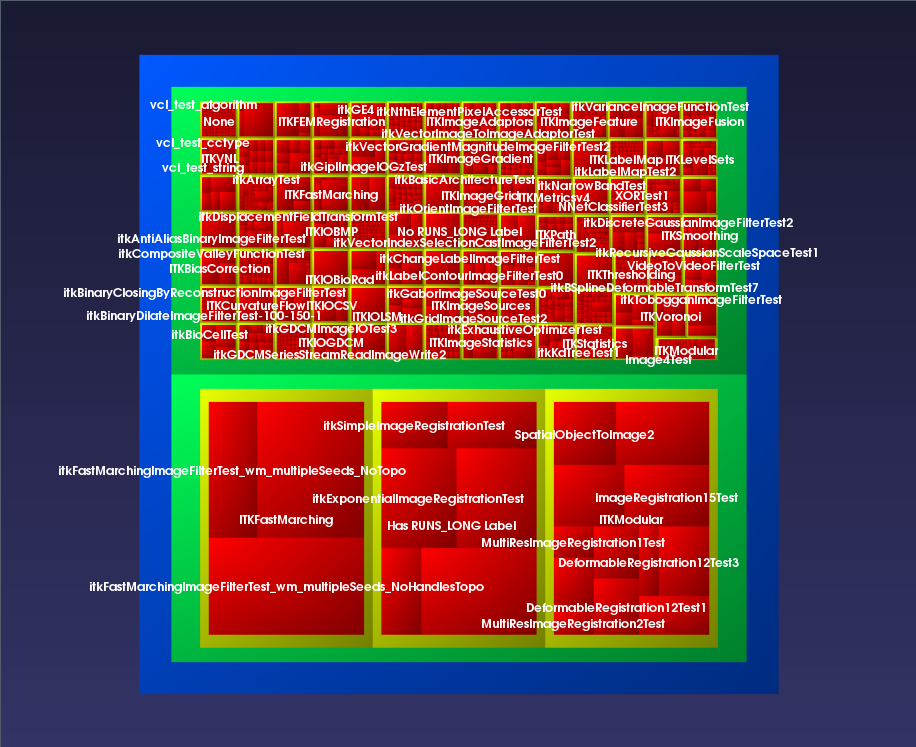 ITK test times organized by module.
Most of the long running tests identified were integration tests, as opposed to unit tests, and tests for advanced algorithms on semi-realistic data. The decrease in code coverage after excluding the tests was 0.25%. To increase the quickness of the edit-build-test cycle, it is possible to exclude the long running tests locally with
ctest -LE RUNS_LONG
For dashboard build platforms that take so long to run that their maintainers may prefer not to run them at all (we’re looking at you, Visual Studio in Debug!), the tests can be excluded with
set(CTEST_TEST_ARGS EXCLUDE_LABEL RUNS_LONG)
Of course, these approaches should only be taken after it is determined that it is not feasible to refactor the code or the tests so they run more quickly.
The script is generally applicable on any system that has VTK Python wrapping installed and uses CTest. For example, screen captures of VTK and CMake test suites are shown below.
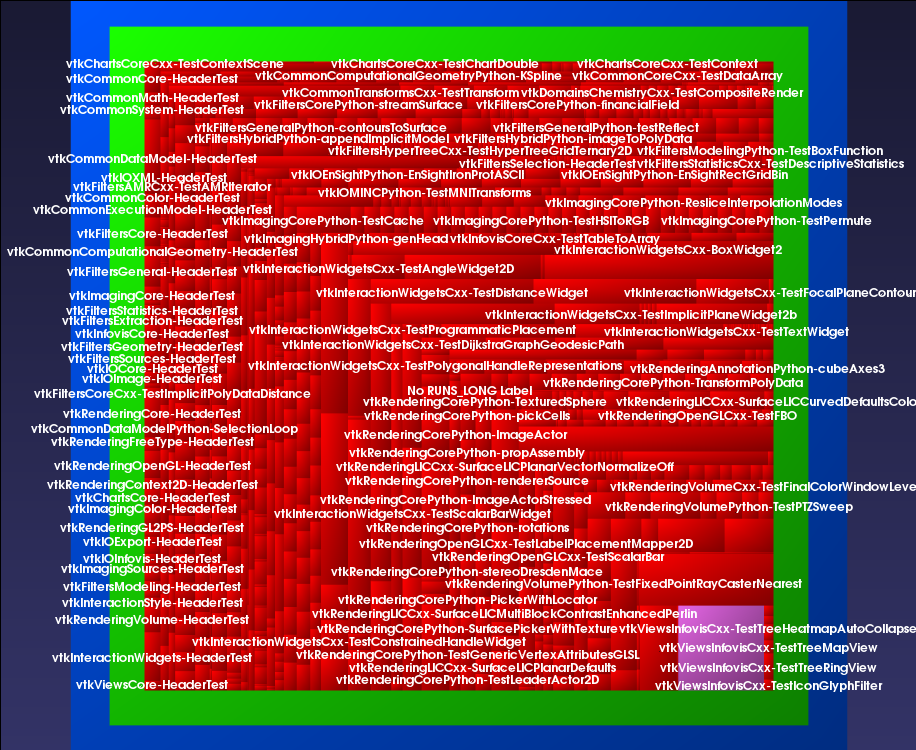 VTK test times.
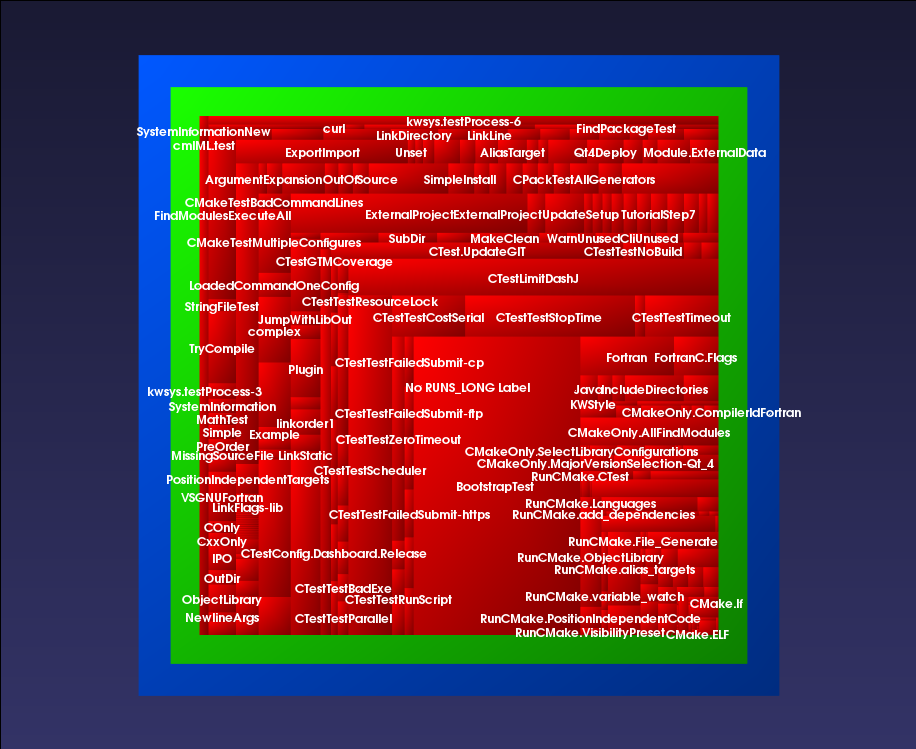 CMake test times.
Very nice !
This is really cool. Nice to see that you were able to use the treemap view that I put in a while back. I’m interested in what was easy or hard about doing this vis in VTK.
@Jeff,
Yes, thank you for getting the work cleaned up into VTK so that it was easily available on a system with Python-wrapped VTK. Without this, it would not have happened!
I started the visualization after stumbling across the Infovis with VTK webinar that was posted on YouTube. It was helpful, but much more documentation and examples would have made things much easier. In particular, I spent most of my time digging through the VTK code to determine what to do with an error related to pedigree id’s.