VTK for Climate Science
While the Visualization Toolkit is widely used for analysis and 3D visualization of scientific data, a fully supported but lesser known application domain is Climate Science. The Community Data Analysis Tools (CDAT) is a data analysis and visualization software package developed at Lawrence Livermore National Laboratory and designed for climate scientists. Starting from 2015, CDAT relies on VTK as its visualization backend. Supporting the CDAT library and addressing requirements from the climate community resulted in bug fixes as well as new features incorporated in VTK. We briefly describe some of the most significant changes below.
Export 2D Plots to PDF and SVG
Upgrading VTK to a modern OpenGL architecture determined a significant rendering speedup and enabled the introduction of many new rendering features to VTK. One important feature, export to vector graphics format, was lost due to the use of a newer OpenGL, which dropped support for OpenGL feedback buffer. To remedy this, we implemented vtkPDFExporter and vtkSVGExporter to export vtkContext2D scenes to PDF and SVG vector formats.
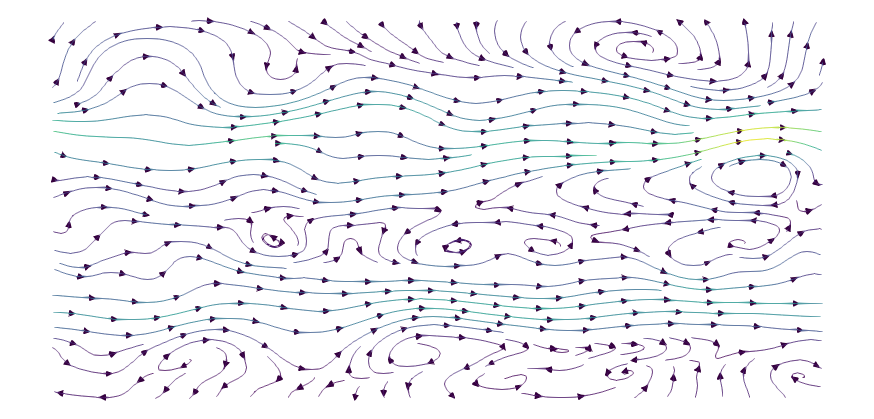
Evenly Spaced Streamlines 2D
We developed vtkEvenlySpacedStreamlines2D (see blog), an implementation for evenly spaced streamlines for 2D datasets. This visualization method enables the user to control the density of streamlines and avoids streamline crowding while providing good coverage of the 2D domain.
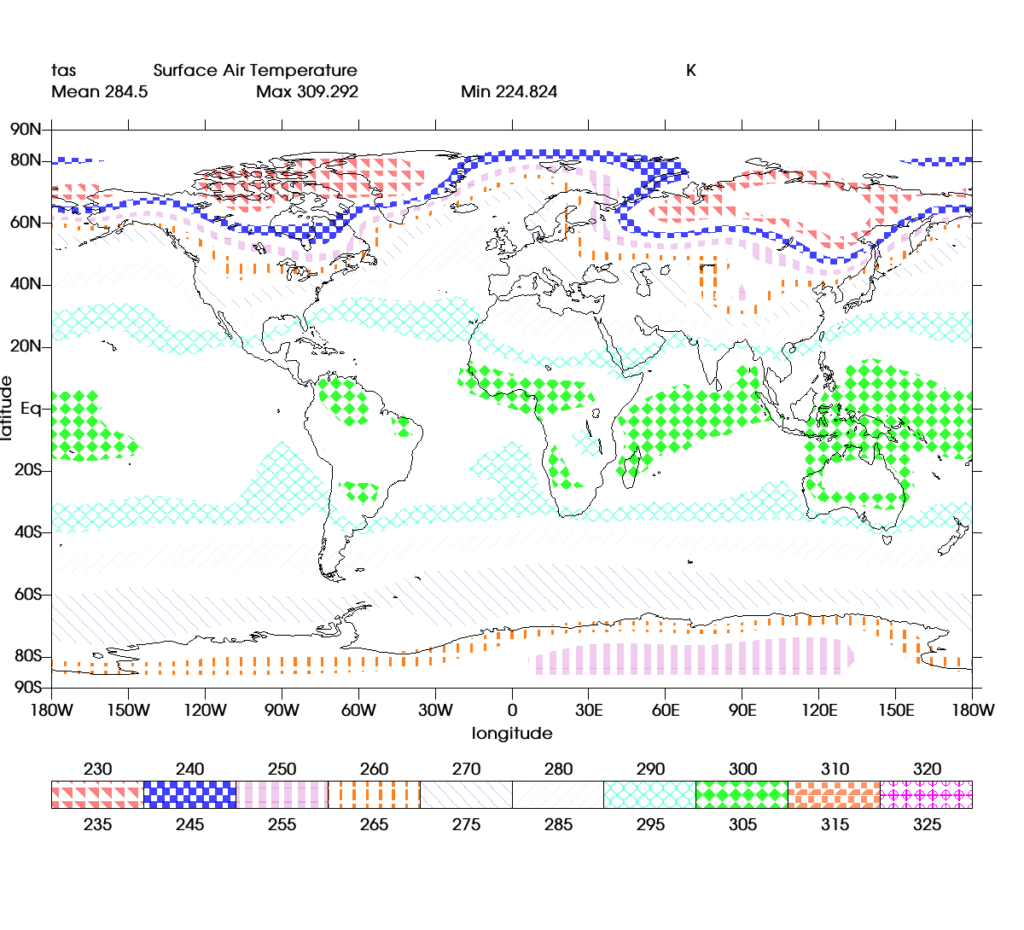
Cookie Cutter
Our collaborators commonly use patterns to mark areas of interest in their simulation results. Often, these results need to be included in print publications so using vector graphics output format is preferred for optimal results. Given these requirements, we developed vtkCookieCutter (see blog) a filter that crops an input vtkPolyData consisting of cells (i.e., points, lines, polygons, and triangle strips) with loops specified by a second input containing polygons.
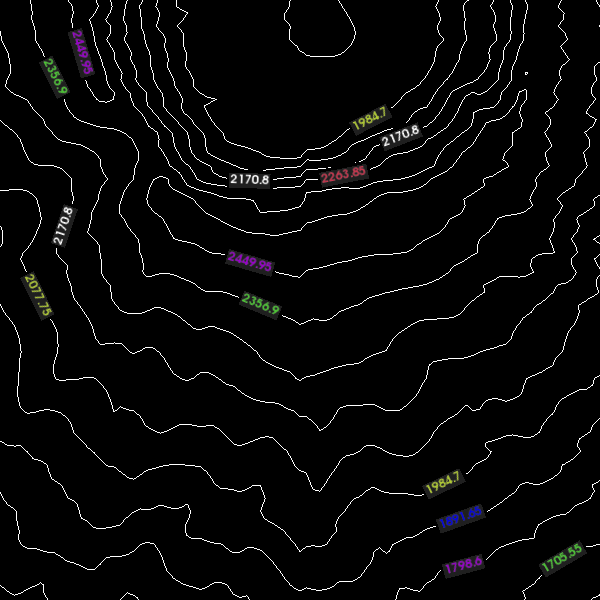
Labeled Contours
Isocontours are plots that represent points of equal scalar value within a dataset. Labeled contours (vtkLabeledContourMapper and vtkLabeledContourPolyDataItem) enable a user to label the contours with the value they represent as in the following figure.
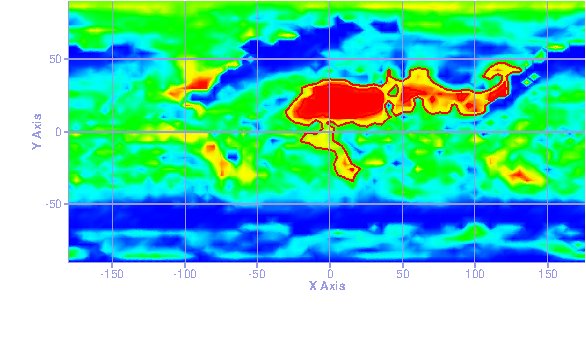
Draw a vtkPolyData onto a Context2D
vtkContext2D is a class for drawing 2D primitives onto a 2D context. This class makes it possible to export 2D plots into a vector format which is not generally possible with modern OpenGL. With this work, we can use Context2D to draw the arbitrarily complex plots needed for the CDAT library rather than only 2D charts originally supported by Context2D.

These major features, along with various other minor features, were added to the VTK to support climate and weather science. Kitware is always looking for interesting challenges in the geosciences domain. If you would like us to customize a solution for you, please contact us at kitware@kitware.com.
Acknowledgment
Special thanks to the Department of Energy (DOE) Lawrence Livermore National Laboratory, DOE Program Manager Dr. Justin Hnilo, LLNL Principal Investigators (PI) Dean Williams and Ghaleb Abdulla, and DOE lead staff member Charles Doutriaux for supporting this work.
Good job! This is a good news. Our technology is evolving compare it to the old graphics in the past years.