A Framework for Next-Generation Visual Workflows in Scientific Computing
The 21st century has witnessed remarkable advances in computational and experimental sciences, with processing power expanding from terascale to exascale—a million-fold increase in capability—and experimental devices achieving unprecedented scales of data collection. Visualization technologies have kept pace, as modern GPUs now enable the analysis and rendering of complex datasets that were once out of reach. At the same time, artificial intelligence has disruptively reshaped research by not only augmenting existing methods but also transforming the problems we can address and the ways we solve them. Scientific and engineering work now depends on the integration of experiments, large-scale computation, and AI, involving diverse participants from domain experts to decision-makers. Yet, traditional tools such as documents, charts, spreadsheets, and static visualizations are no longer sufficient to support collaboration.
Visual workflows address this gap by providing interactive, domain-aware environments that make complex pipelines understandable and actionable. They democratize access to AI, simulations, and experiments by lowering technical barriers, enabling the transfer of expertise by providing both specialists and non-specialists with productive entry points, and enhancing analysis and communication by allowing users to interrogate results dynamically and present them clearly to diverse audiences. Interactive visual workflows enable activities such as AI/experiment/simulation-to-insight exploration, AI-assisted validation, automated report generation, and migration of traditional desktop tools into collaborative web applications. Their visual nature allows users to see and then manipulate the workflow process, not just the experimental or simulation data. By making processes transparent, adaptive, and inclusive, visual workflows shorten iteration cycles, accelerate discovery, and empower all participants to contribute insights directly.
The next generation of research and design will rely on such interactive visual workflows, which, by extending powerful tools beyond computational specialists to entire collaborative communities, can unlock new levels of innovation and discovery.
Visualization as a Tool for Accessibility and Insight
Visualization is fundamental to interactive visual workflows because it transforms raw data into forms the human eye and brain can quickly grasp. Numbers in files or static tables cannot match the speed and clarity of visual analysis, where patterns, anomalies, and structures often emerge only through inspection. By working visually, scientists, engineers, and researchers expand cognitive bandwidth, accelerate understanding, and foster collaboration. Well-designed visualizations make insights accessible to both experts and non-experts, creating a shared ground for decision-making.
Challenges
Modern research and engineering workflows are difficult to manage. They involve massive datasets that must be cleaned, wrangled, streamed, and stored at scale. They span many stages—from simulation and experiment setup to AI-driven analysis and visualization—and depend on diverse tools that rarely interoperate smoothly. Each step adds layers of complexity, from managing workflow attributes and assets to ensuring data integrity and reproducibility. While the AI, simulation, or experiment may complete in only weeks on 21st-century computational platforms, the resulting data can be so large that analysis and visualization are constrained to a read-once, derive-once workflow, in which each dataset is read only once to produce a reduced or derived product. Even under this limited approach, the process can take many months and may spill into the next computational allocation cycle.. This delay becomes a major barrier, slowing iteration and extending the time-to-discovery. The central challenge is not the absence of capable tools, but the difficulty of integrating them into coherent workflows that support collaboration, efficiency, and timely insight.
| Challenge | Value Proposition |
|---|---|
| Democratization of Advanced Capabilities | |
| Powerful AI, simulation, experiment, analysis, and visualization tools remain concentrated in the hands of specialists, leaving non-experts dependent on intermediaries and slowing collaborative progress. | Democratizing advanced capabilities empowers all participants in a workflow to contribute to insights directly, fostering inclusive collaboration and innovation. |
| Seamless Transfer of Expertise | |
| The flow of expertise between developers of AI, simulations, and experiments and their end users is slow and inefficient. Specialists become bottlenecks, and tools are often either too simple or too complex. | Interactive visual workflows that speed expertise transfer and provide customizable, domain-specific environments allow experts and non-experts to engage productively without unnecessary complexity. |
| Insightful Analysis and Communication | |
| Traditional tools for analysis and visualization are too rigid or too general. Researchers need to explore results dynamically, while stakeholders need clear and compelling views. | Interactive visual workflows accelerate discovery and facilitate the communication of insights across diverse audiences, enabling more informed and collaborative decision-making. |
| Shortening Time-to-Discovery | |
| Complex workflows and fragmented tools often result in lengthy delays between data generation and actionable insights. While simulations, experiments, or AI runs may finish in only weeks, the analysis and visualization of their results can take months. | Integrated, interactive visual workflows shorten the path from raw data to understanding. By reducing months of post-processing into immediate, adaptive visual exploration, they enable faster prototyping, validation, and decision-making. |
Toward a Next Generation Platform
Over the past two decades, the visualization community has developed systems capable of interactively handling vast datasets. Tools such as ParaView exemplify these capabilities, but they remain monolithic and best suited for experts. What is needed now is a flexible platform that spans various use cases, encompassing desktop, Jupyter, and web environments while lowering development effort.
The urgency is apparent. Today, scientists, engineers, and researchers can complete an extensive simulation, experiment, or AI campaign in a matter of weeks on advanced computational platforms. Yet, the analysis and visualization of the resulting data can still exceed computational allocation boundaries, delaying discovery and slowing innovation. This gap between data generation and actionable insight is now one of the most pressing barriers in scientific and engineering practice.
The answer lies in a modular platform. This platform must build on decades of investment in frameworks like VTK and ParaView while adopting modern interface technologies. It should support workflows ranging from physics-based AI to combined experiment–simulation pipelines, end-to-end simulations, and cross-disciplinary analytics. By addressing the challenges of democratization, expertise transfer, communication, and time-to-discovery, this platform can collapse months of post-processing into interactive visual workflows that deliver insight at the pace of computation.
At Kitware, we have been developing components for this platform while transforming our existing frameworks to support the future of visual workflows. The core is written in C++ (with CUDA, HIP, and SYCL) for optimal performance, and Python is used as the integration language to reduce barriers to entry while maintaining flexibility and speed. On top of this foundation, we employ trame, our visual workflow integration framework, which allows developers to build components, combine them into complex workflows, and deliver them seamlessly on desktops, in Jupyter notebooks, or on the web. Backed by HPC resources such as cloud or supercomputers, these workflows reduce the cycle from months to days.
Core Components
Run-Everywhere Front-End
Modern workflows demand applications that run seamlessly across desktops, Jupyter notebooks, and the web. Our front-end layer provides this portability, ensuring that visual workflows are accessible wherever researchers and engineers work, and that deliver the same components across environments without duplication of effort.
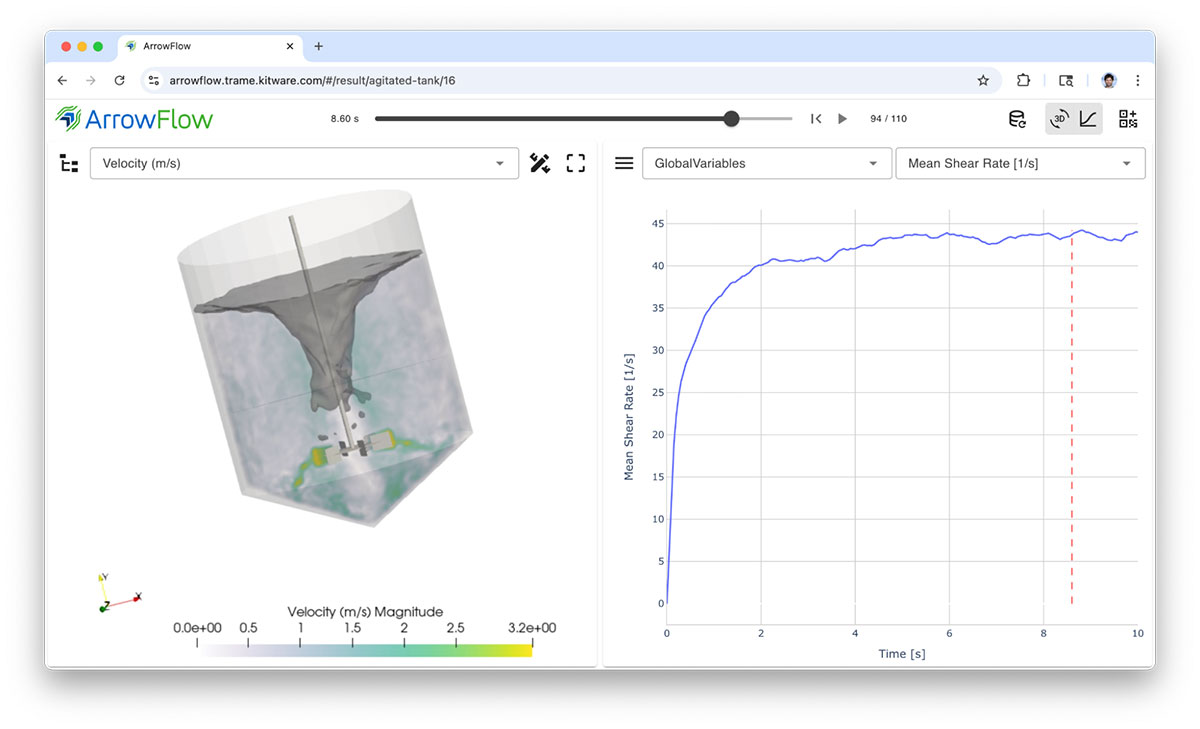
Trame is the glue that binds the platform together. As a Python-based framework for creating interactive visual workflows, trame integrates scientific libraries, AI tools, and modern web UI components. It lowers technical barriers, supports rapid development, and ensures interoperability between front-end and computational backend frameworks. By doing so, it creates an environment where visual workflows can be composed, extended, and shared.
Backend Frameworks
We built the core of the platform on proven frameworks that address the significant gaps in today’s workflows:
- VTK provides a comprehensive set of libraries for I/O, data models, analysis, rendering, and graphics.
- ParaView builds on VTK to provide distributed computing client–server operation while scaling from laptops to supercomputers. Together VTK and ParaView handle massive datasets, ensure high performance, and provide the visualization backbone needed for both experts and non-experts to interrogate complex results.
- SMTK addresses the complexity of workflow attributes and asset management, enabling users to define, track, and reuse workflow resources, including parameters, geometries, meshes, materials, and boundary conditions. SMTK supports flexible integration with the other frameworks, enabling interactive workflows that connect setup, execution, analysis, and visualization as well as providing ways of decomposing a workflow into a set of interactive tasks.
- Fides simplifies access to simulation and experimental outputs by streaming data at scale, reducing friction in moving results from producers to consumers.
- Catalyst enables the in-situ coupling of simulations and experiments with analysis and visualization, ensuring the processing of data as it is generated, rather than months later. Fides and Catalyst close gaps between data producers and data consumers, allowing workflows to incorporate real-time analysis, AI training, and experimental streaming without costly intermediate steps.
Together, these backend frameworks tackle the most challenging tasks: massive data volumes, data cleaning and wrangling, multi-stage workflows that rely on diverse tools, and the complexities of managing assets and ensuring reproducibility.
Desktop Applications
For off-the-shelf use, our desktop applications make these capabilities directly accessible to scientists and engineers:
- ParaView for scalable visualization and analysis of massive datasets.
- CMB (Computational Model Builder) for building and managing complex simulation workflows.
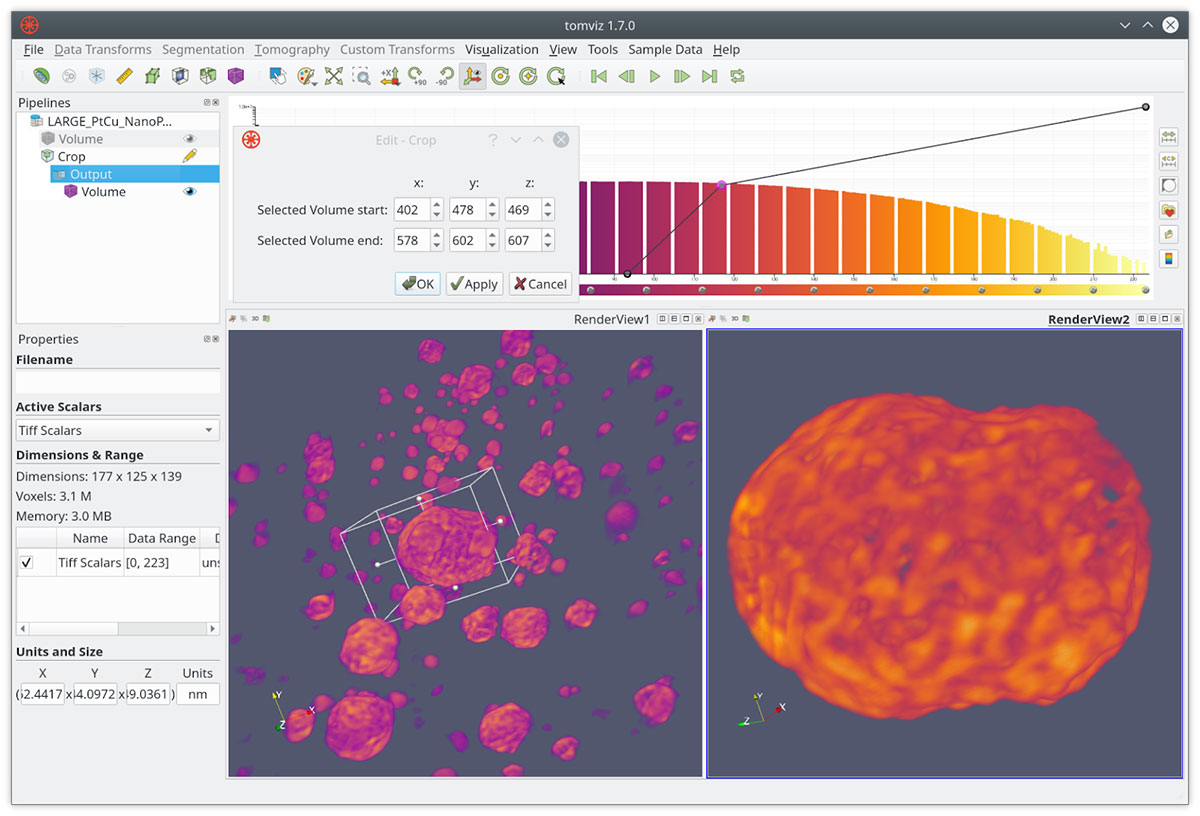
- Tomviz for interactive analysis and visualization of large-scale tomography data.
These applications embody the power of the backend frameworks while providing usable, production-ready environments. They serve both as entry points for new users and as full-featured platforms for experts.
Examples
The power of this platform is best understood through concrete use cases. By combining run-everywhere front ends, trame, robust backend frameworks, and production-ready desktop applications, researchers can assemble visual workflows that address real challenges. The following examples illustrate how these components work together to manage massive datasets, streamline data movement, connect simulations with analysis, and simplify complex workflows into environments that accelerate discovery.
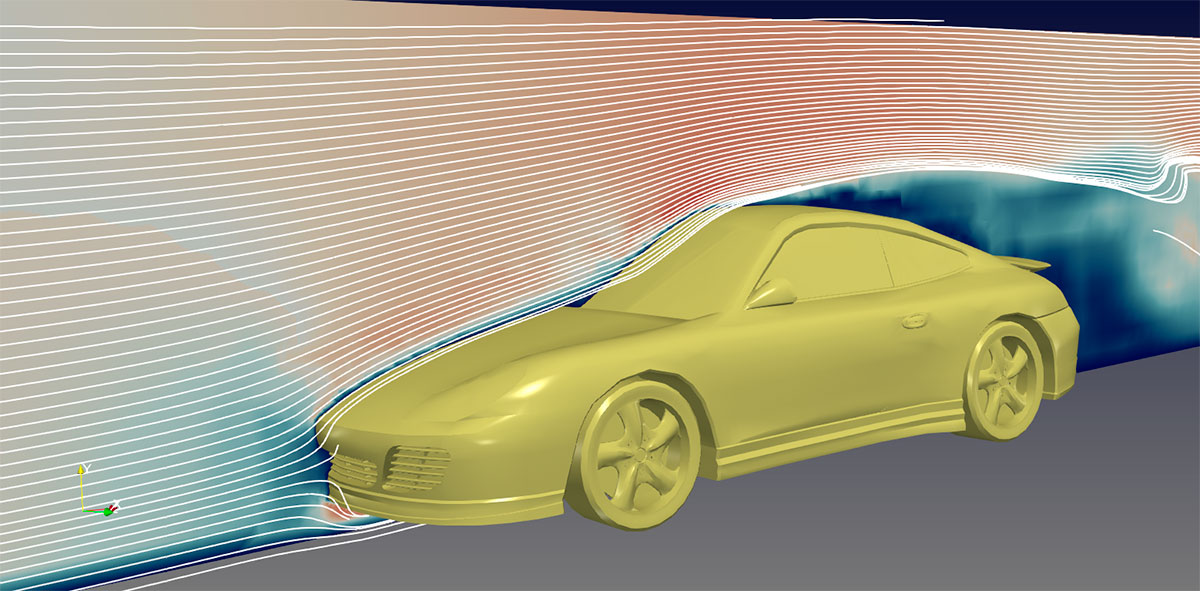
Frameworks used: ParaView, Catalyst
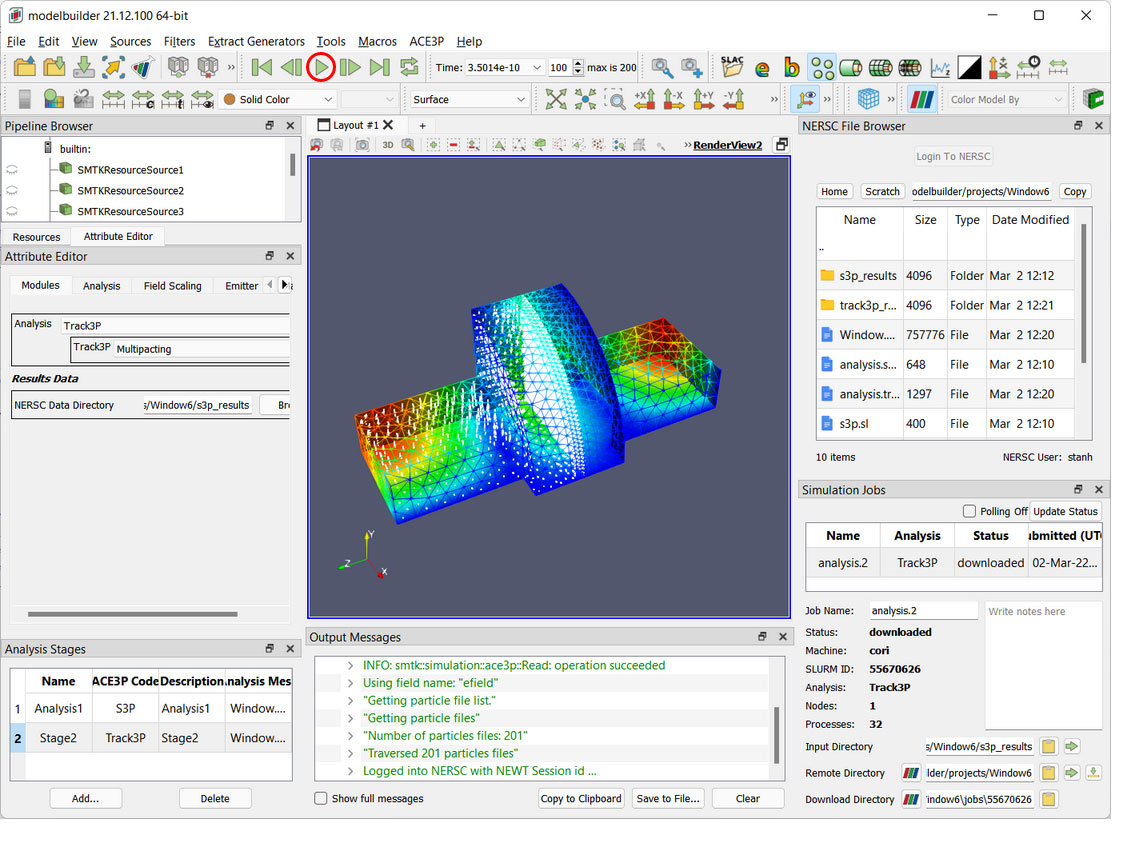
Frameworks used: SMTK, CMB, VTK, ParaView.
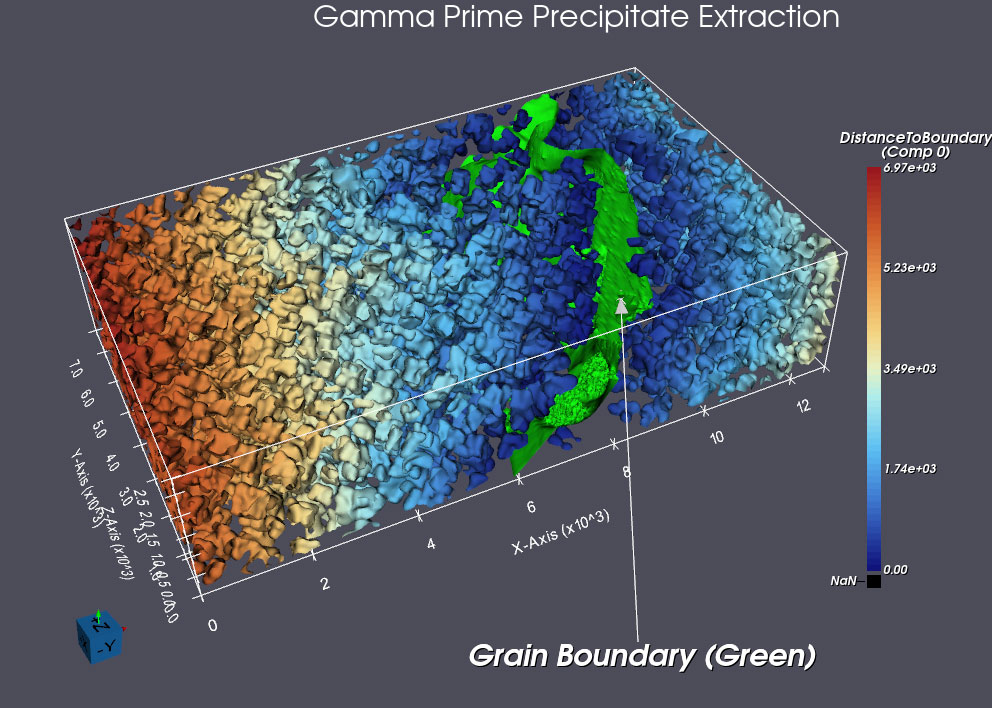
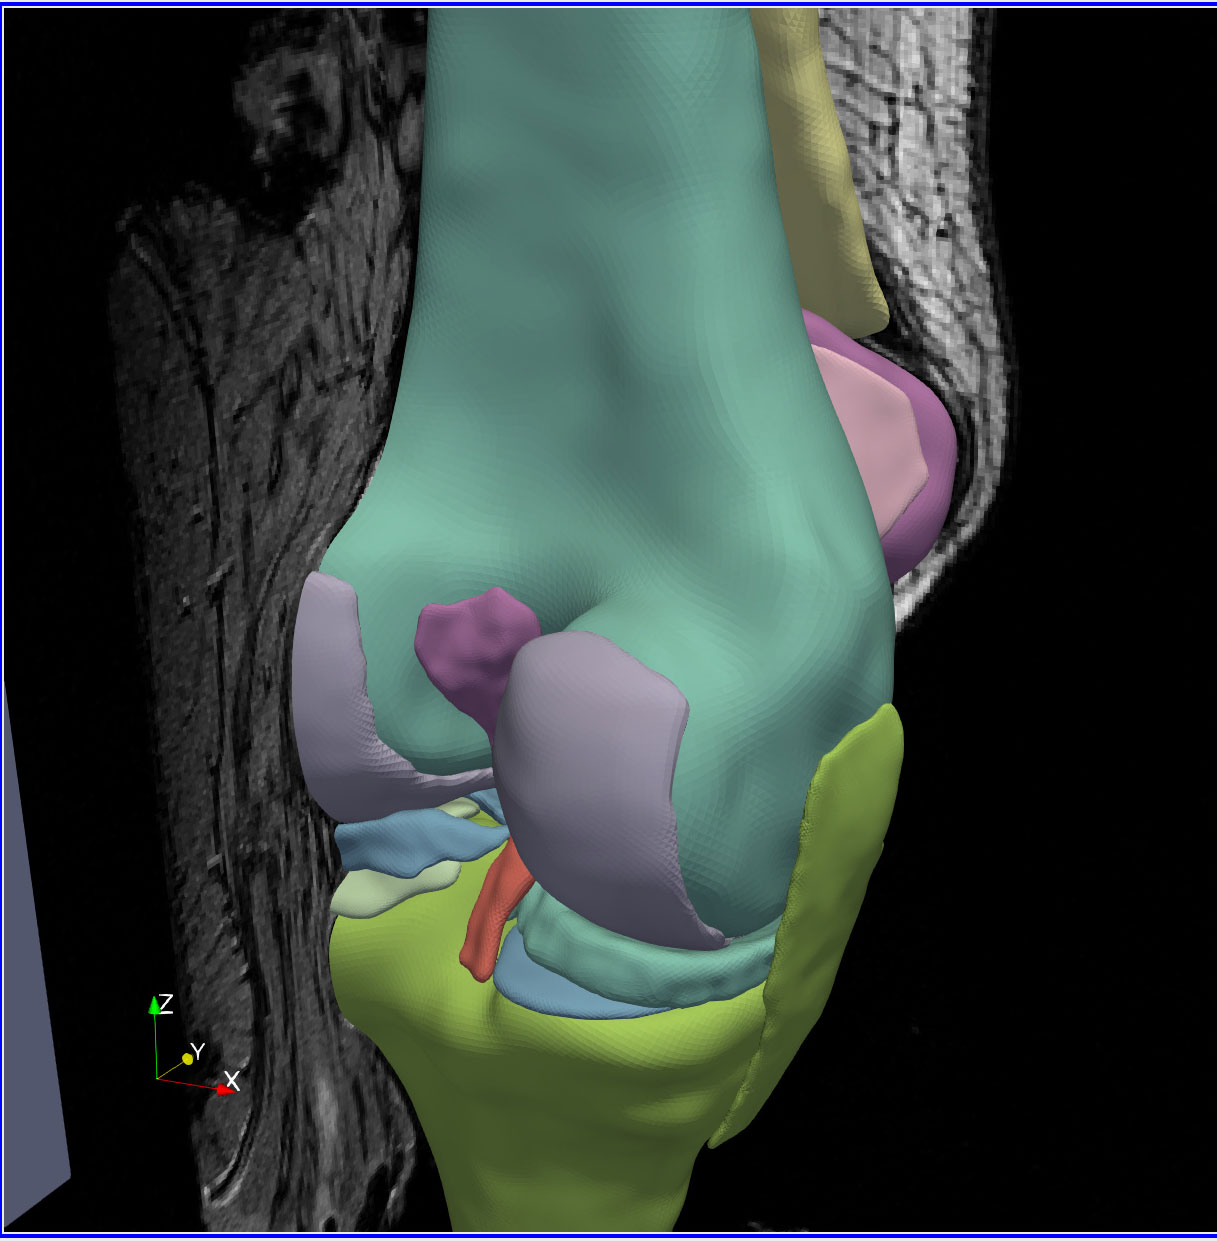
Frameworks used: SMTK, VTK, ParaView
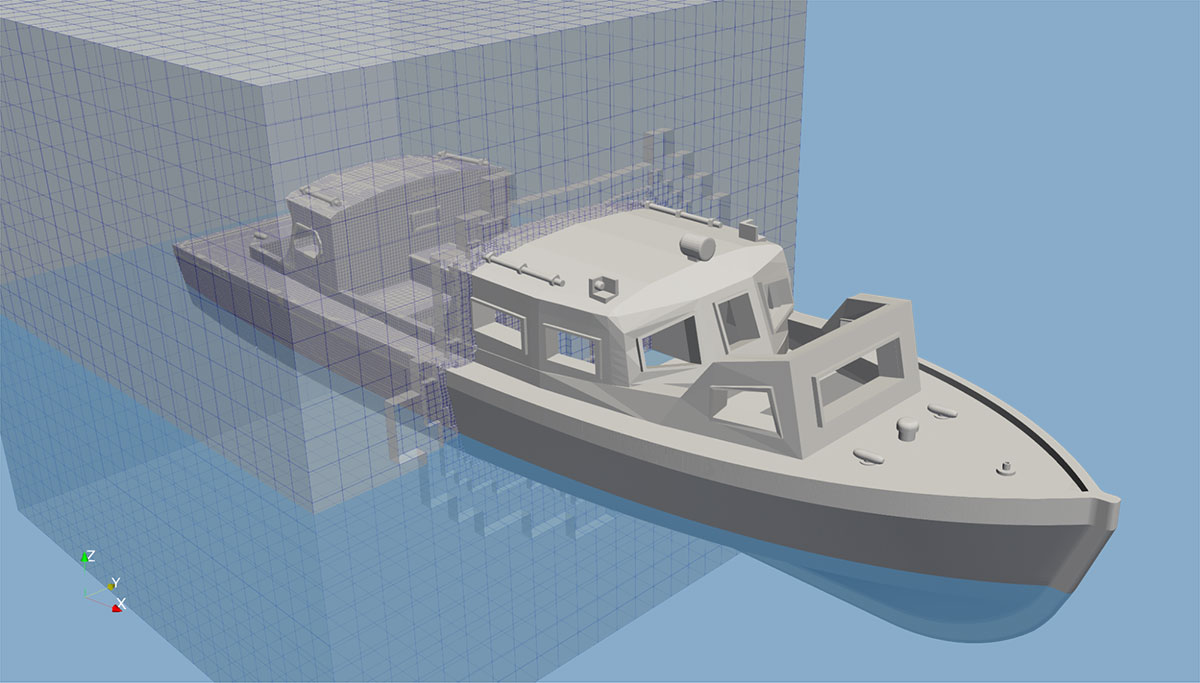
Frameworks used: SMTK, CMB, ParaView, VTK
Frameworks used: SMTK, CMB, ParaView, VTK
Frameworks used: VTK, CMB ParaView, SMTK.
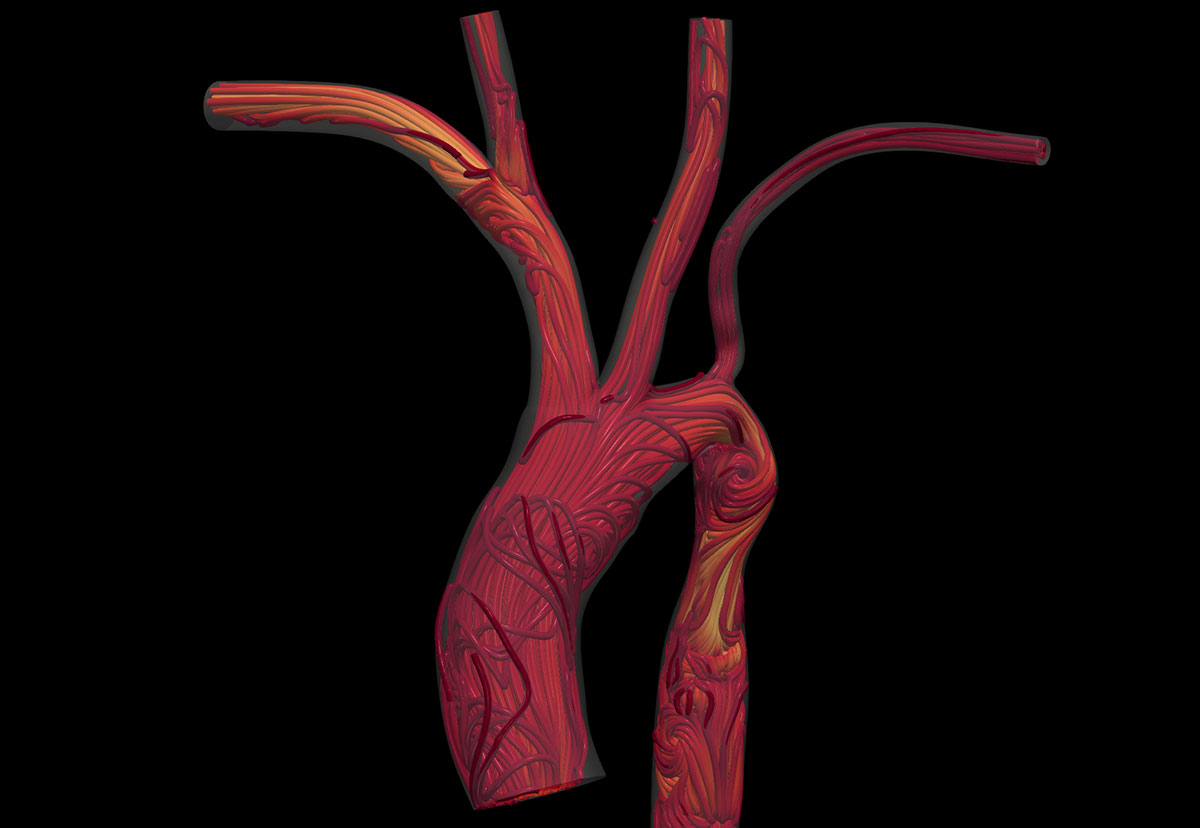
The accompanying images illustrate work from the Randles Lab at Duke University, where methods for whole-body circulatory system simulation are being developed, modeling down to individual blood cells using the HARVEY fluid dynamics solver. The video showcases blood flow within a representative human aorta, originating at the ascending aorta, traversing the aortic arch, and concluding at the descending aorta. As the fluid enters the aortic arch, it diverges into the right and left subclavian and common arteries. To mimic in vivo circulation, the flow constantly pulses throughout the animation. Frameworks used: ParaView, ParaView Catalyst
Frameworks used: ParaView, Catalyst
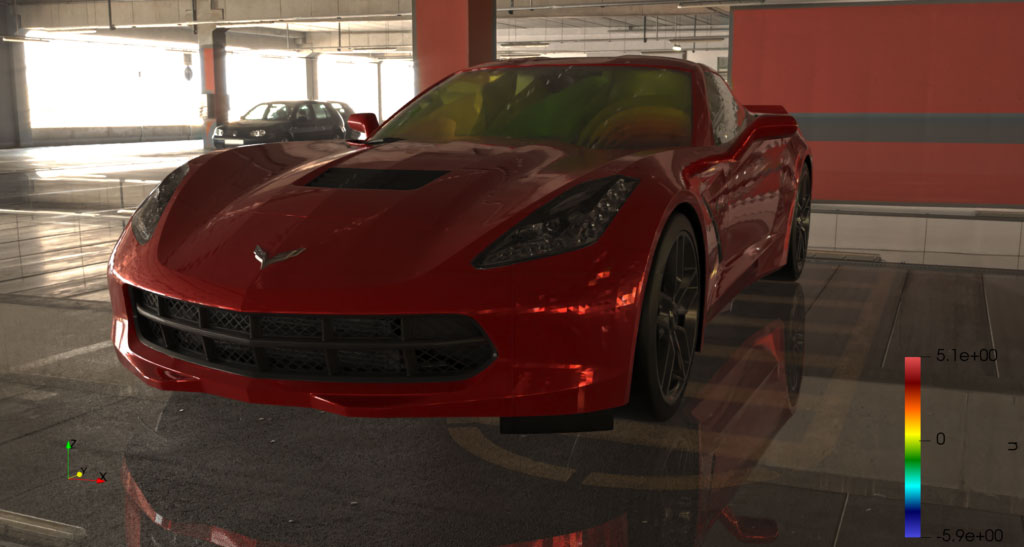
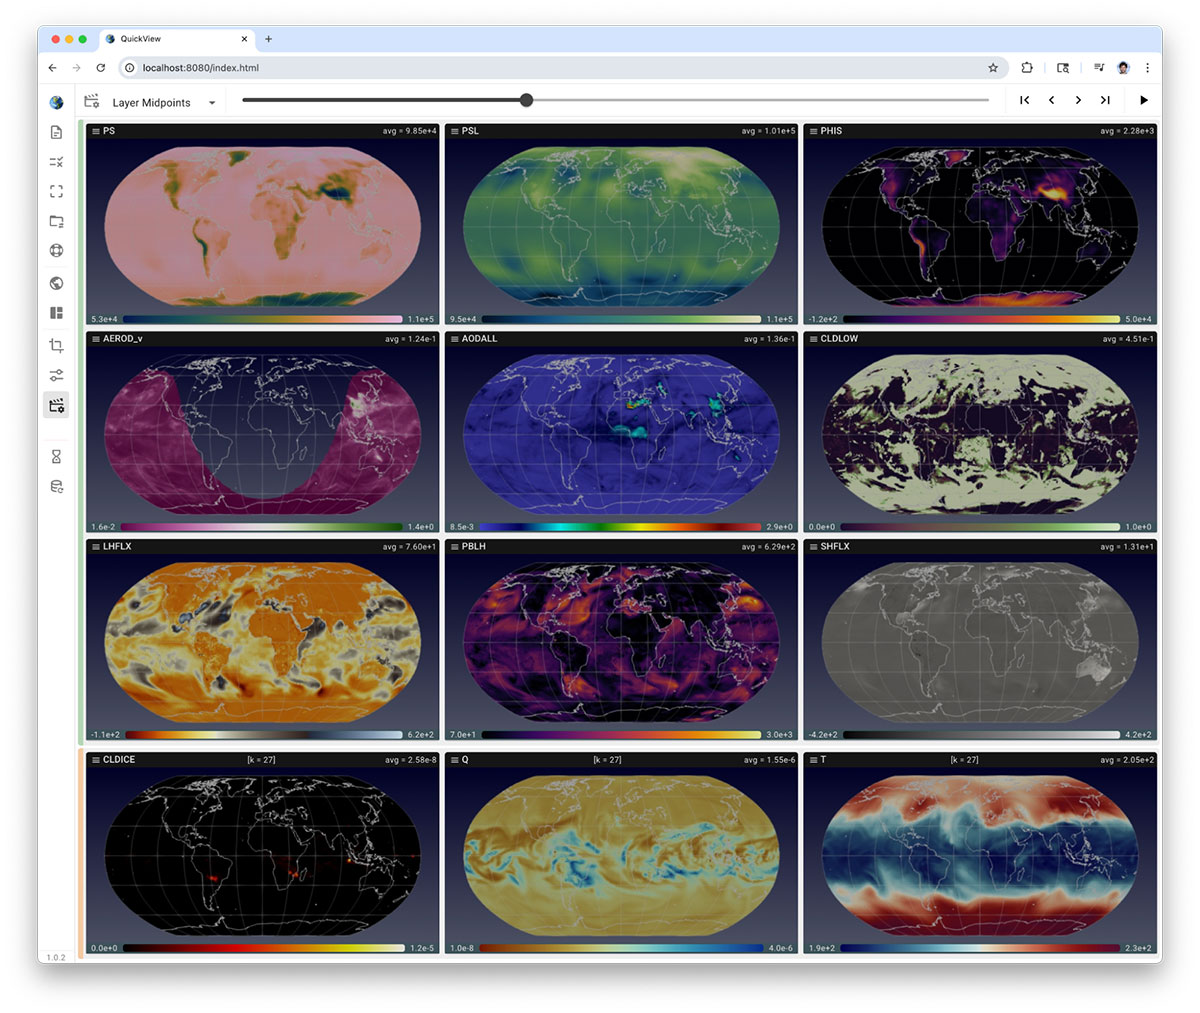
Frameworks used: Trame, VTK
Frameworks Used: trame, VTK
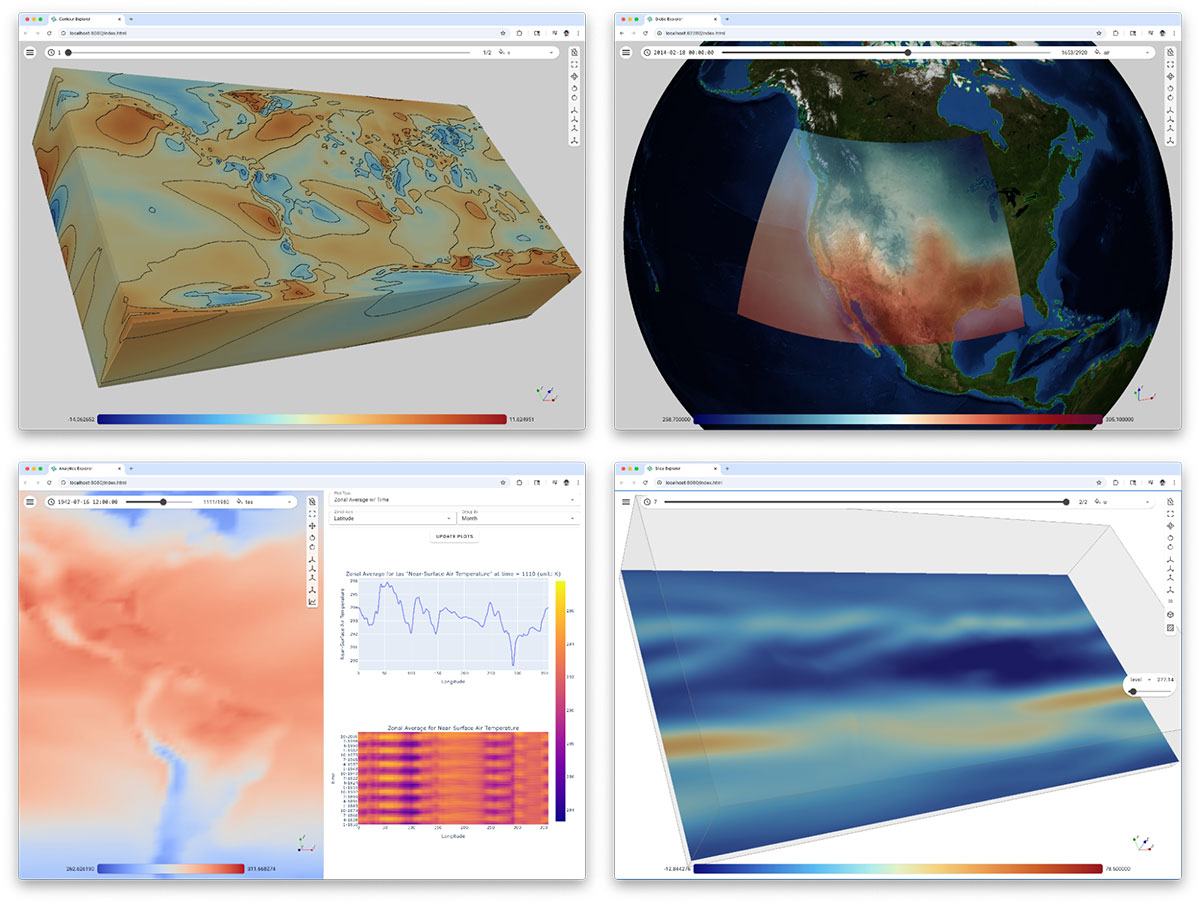
Platforms: VTK and trame
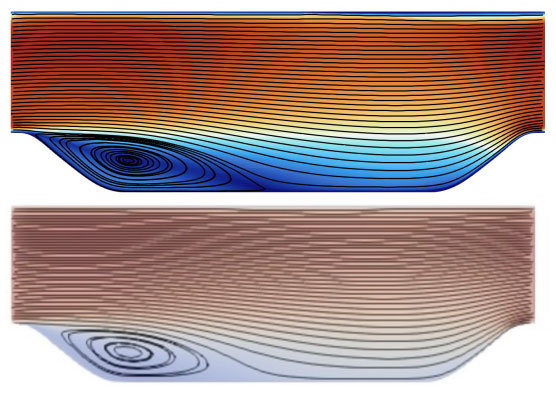
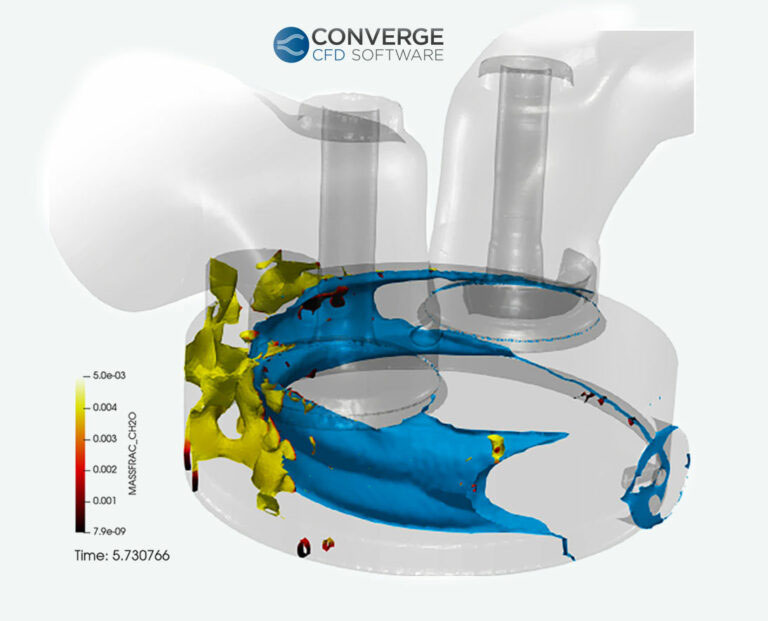
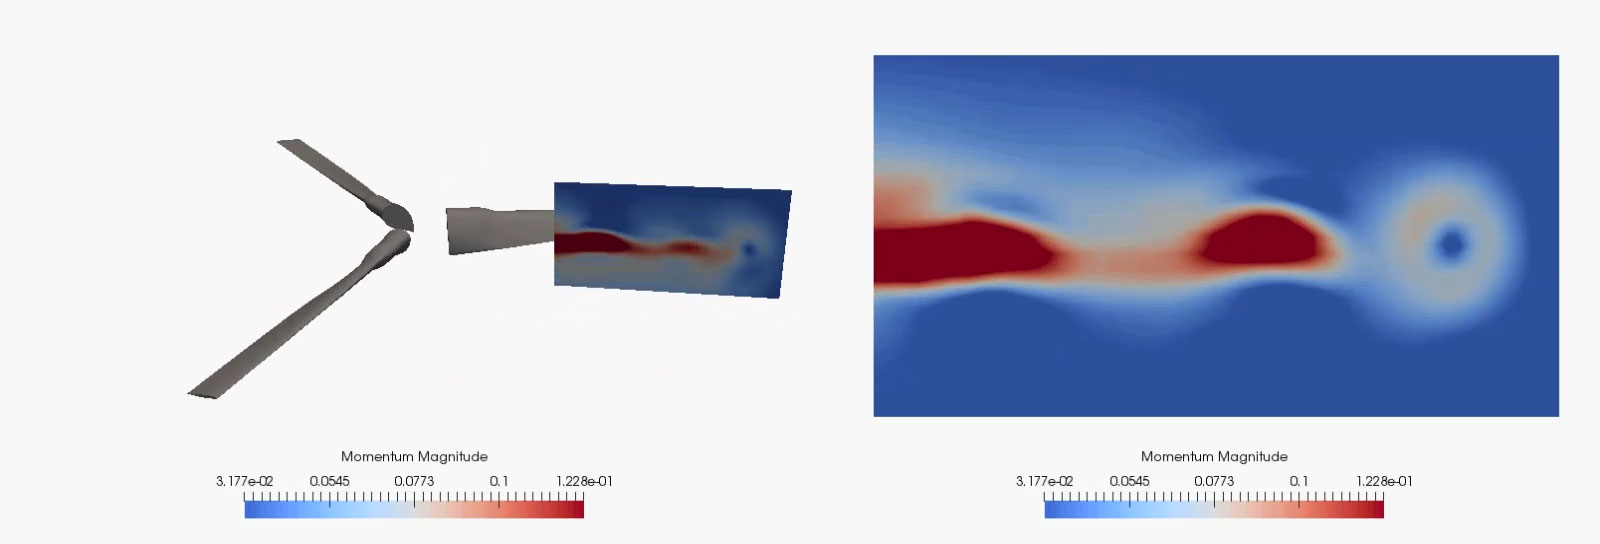
By incorporating in situ capabilities directly into the simulation workflow, developers and analysts can scrutinize crucial variables at each timestep, thereby avoiding the significant overhead associated with I/O and storage. This methodology not only optimizes HPC resource utilization but also facilitates real-time steering, swift validation, and more insightful diagnostics during protracted simulations. The accompanying images illustrate this approach using CREATE’s HELIOS framework, which leverages ParaView Catalyst for in situ visualization and analysis.
Frameworks used: Trame, ParaView