GeoGate: Generic Co-processing for Coupled Earth System Models with ParaView Catalyst
This is a guest blog post from Ufuk Utku Turuncoglu from the NSF National Center for Atmospheric Research (NCAR). He shares his work on GeoGate, an open source component that brings ParaView Catalyst to Earth system models coupled through ESMF/NUOPC. Thanks to his approach of placing in situ analysis in the coupling layer that all components share, a single Catalyst integration now serves models such as the UFS Weather Model and UFS Coastal, and has already been used to find coupling bugs and add visual diagnostics to regression tests.
The Data Deluge in Earth System Modeling
Earth system models now run at kilometer-scale resolution, with global atmosphere and ocean components carrying roughly 20 million horizontal grid points across a hundred-plus vertical levels. But that fidelity comes with a data problem traditional post-processing can no longer handle: a single hour of output from the WRF-based CONUS404 dataset (Rasmussen et al., 2023) occupies roughly 450 GB. At these volumes, storing and moving output can cost more than the computation that produced it, so scientists routinely discard most of what their models compute, saving results too coarsely (daily or monthly) to capture the fast processes such as convection, air-sea exchange, and eddy dynamics that motivated the high resolution in the first place.
In situ analysis offers a way out: analyze and render the data while it still lives in memory, and write only the insight, not the deluge. This post describes GeoGate, a generic co-processing component that brings ParaView Catalyst to coupled Earth system models, not by instrumenting each model individually, but by integrating in situ analysis directly into the coupling layer they already share. The result lowers the barrier to in situ analysis: easy to integrate, efficient at runtime, and demanding minimal effort from model developers.
Why Coupled Models Are a Harder Target
Earth system models are not monolithic codes but sets of components (atmosphere, ocean, sea ice, waves, and land), each developed by a different community, discretized on its own grid, and mostly written in Fortran. The Earth System Modeling Framework (ESMF; Hill et al., 2004) and the NUOPC layer built on top of it provide a standardized way to couple them: an ESMF/NUOPC driver orchestrates the time loop, connectors regrid and move data between components, and mediators such as CMEPS compute the atmosphere-ocean fluxes that bind them together (Figure 1). Each component is wrapped in a small “cap” that exposes its data in a standard way.
This architecture is exactly what makes in situ analysis harder than in a standalone code. A traditional Catalyst integration would mean writing and maintaining a separate adapter inside each model (UFS-ATM’s FV3 cubed-sphere atmosphere, MOM6’s tripolar ocean grid, SCHISM’s unstructured coastal mesh), translating each one’s data structures by hand and repeating that effort for every new model, all while making it hard to analyze the coupled system as a whole. A better approach is to add in situ analysis directly to the coupling layer every component already shares and standardize data translation between physical model and in situ analysis.
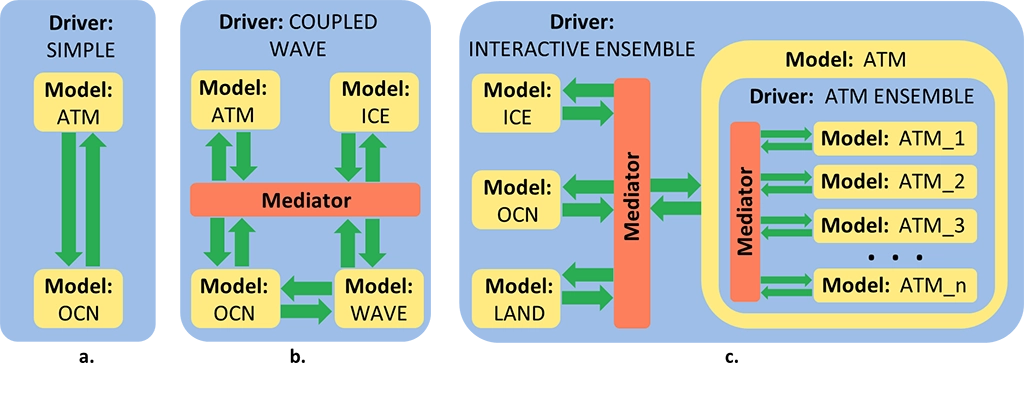
Figure 1. Example designs of fully coupled modeling systems: (a) a simple atmosphere-ocean connection without a mediator; (b) the Navy COAMPS system; and (c) a multi-model interactive ensemble with two mediators. Adapted from the NUOPC Interoperability Layer documentation.
Lessons from RegESM: The First Attempt
Our earlier work pairing ParaView Catalyst 1.0 with the regional coupled model RegESM (Turuncoglu, 2019; Turuncoglu et al., 2019) was the first demonstration of in situ visualization in a fully coupled model, but it exposed a real limitation: the adapter had to manually convert ESMF grids and fields into VTK data structures through a chain of Fortran-to-C translations, and it handled only a single regular latitude-longitude grid. Catalyst 2.0 removed this obstacle by replacing the manual translation with the Conduit API (Harrison et al., 2022), which it also uses as its data model. On the simulation side, all that remains is to describe meshes and fields as Conduit nodes following the Mesh Blueprint protocol, far simpler than building VTK objects by hand, and Catalyst handles the VTK conversion internally. That change, together with recent ESMF/NUOPC improvements, is what makes a generic, model-agnostic integration like GeoGate possible.
The Generic Co-processing Component: GeoGate
GeoGate’s idea is simple: instead of adding a Catalyst adapter to each model, in situ analysis becomes a component of the coupled system itself. GeoGate is a flexible NUOPC-based component that can be added to any ESMF/NUOPC application (NOAA’s UFS Weather Model, NCAR’s CESM) and can handle data flowing from several components at once. Once connected, it mirrors the export fields of each attached component into its own import state and exposes them to ParaView Catalyst through a plugin, with no modification to the model components themselves (Figure 2).
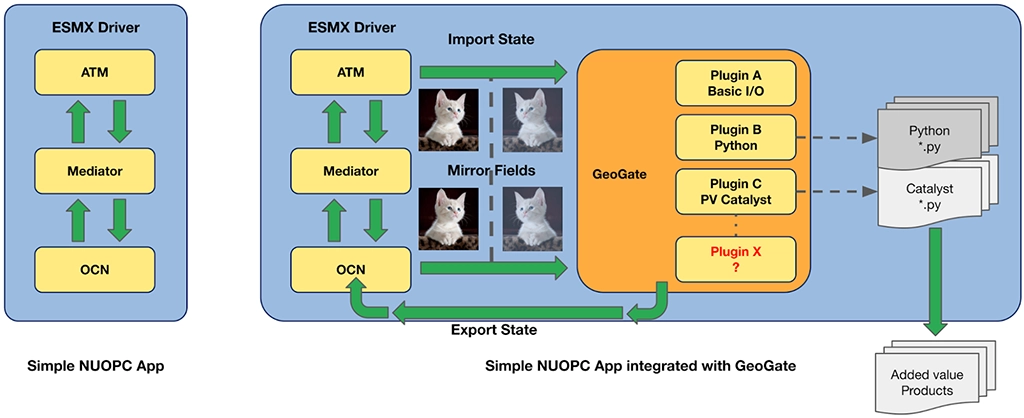
Figure 2. A traditional atmosphere-ocean system (left) versus a GeoGate coupled system (right). GeoGate can trigger multiple plugins in a specific sequence by invoking different phases of the NUOPC protocol.
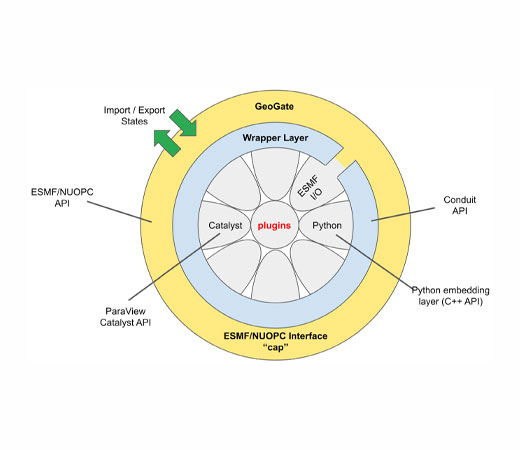
Internally, GeoGate has three thin software layers (Figure 3). The NUOPC “cap”, which is a lightweight software wrapper to translate model specific data structures and grids to ESMF objects, lets it participate in the run sequence like any other ESMF/NUOPC component. Beneath it, a Conduit-based data layer describes each component’s mesh and fields as Conduit nodes, passing field pointers with zero copies. At the bottom, a plugin layer consumes those nodes: the ParaView Catalyst plugin hands them to Catalyst, which converts them to VTK internally and runs the pipeline. Because the cap and Conduit layers are entirely generic, adding a new capability means writing only a new plugin, never touching the coupling logic.
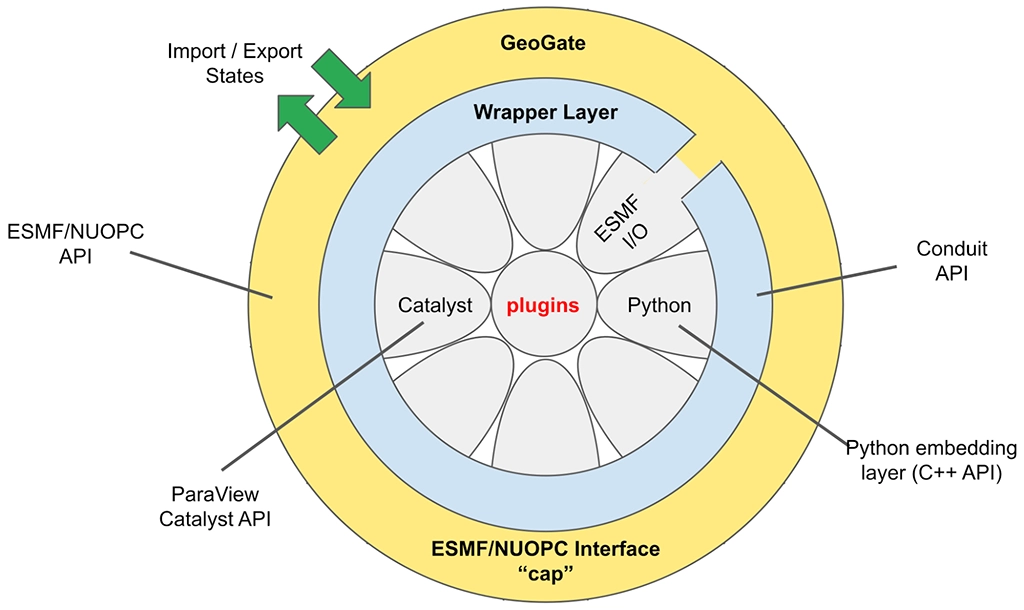
Figure 3. Architectural design of GeoGate. Yellow marks the ESMF/NUOPC “cap”; green arrows are its import and export states; the light-blue wrapper layer connects to the available plugins shown in the middle.
Each connected component is represented as a separate channel carrying its own grid and fields. Data from an FV3 cubed-sphere atmosphere and a MOM6 tripolar ocean can therefore flow through the same component simultaneously, each in its native form (exposed as catalyst/channels/atm, catalyst/channels/ocn, and so on), with no forced regridding to a common mesh and no loss of fidelity before analysis begins. Catalyst then drives visualization pipelines exported from ParaView as Python scripts, producing derived fields at very high temporal resolution, down to every coupling step.
Because GeoGate is an ordinary NUOPC component, nothing limits a system to a single instance. Multiple instances can sit at different points in the run sequence (one rendering the atmosphere while another runs quality control on the ocean channel), and since instances both receive and export fields, they can feed one another, enabling chains of processing stages such as detecting a developing feature and triggering an AI/ML emulator (Figure 4). GeoGate also builds with a lightweight CMake system and minimal dependencies, installable through Spack or spack-stack, so it drops into existing build systems and CI/CD pipelines with little effort.
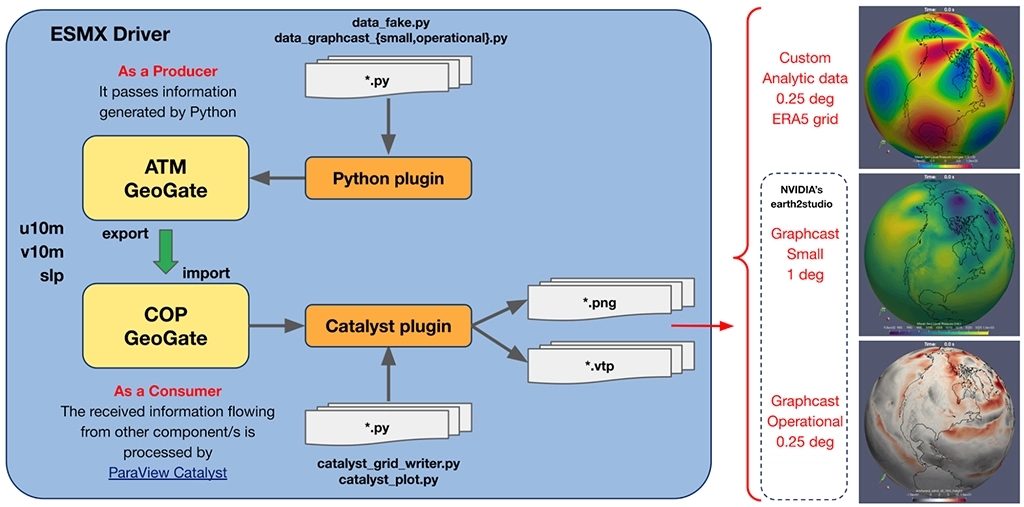
Figure 4. A multi-instance GeoGate configuration: one instance is a producer (ATM, generating data through its Python plugin) and the other a consumer (COP, rendering that data with the ParaView Catalyst plugin).
Added Value of Using ParaView Catalyst
While in situ analysis is best known for eliminating I/O cost, GeoGate has shown us that its real value extends to model debugging and automated testing, especially for complex coupled systems.
a) Catching a coupling bug on 8K cores
The most convincing case for in situ analysis came from a debugging session. In a high-resolution UFS Coastal configuration (CDEPS data atmosphere, SCHISM unstructured ocean, and WaveWatch III running on roughly 8,000 processors), Catalyst-rendered images of sea surface height revealed an imprinting artifact tied to the ocean model’s domain decomposition, appearing at the very first coupling step. In a traditional workflow this signal would likely have been invisible: buried in terabytes of raw output, averaged away in history files, or never written at the frequency needed to see it. With GeoGate, the problem announced itself in a rendered frame while the simulation was still running, turning what could have been days of forensic post-processing into an immediate visual diagnosis (Figure 5). The issue was then fixed in SCHISM’s ESMF/NUOPC coupling layer.
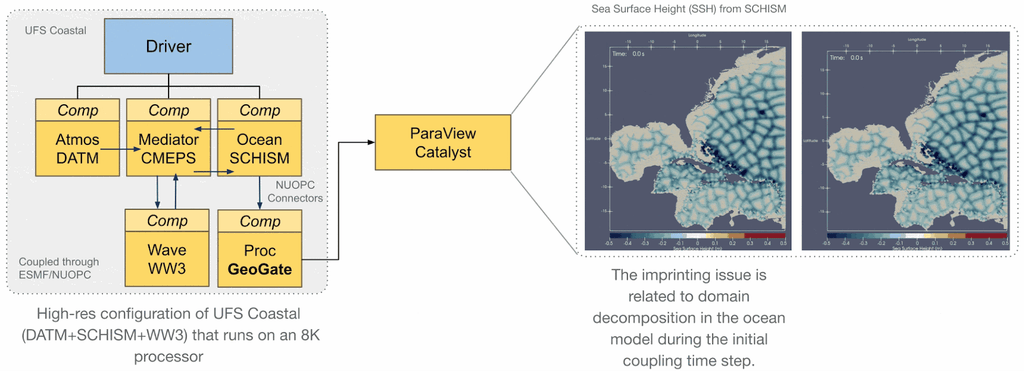
Figure 5. Animation from the UFS Coastal configuration with GeoGate’s ParaView Catalyst plugin. The domain-decomposition imprint is clearly visible at the first coupling time step.
b) Using In Situ for Quality Control and CI/CD
Coupled systems like UFS WM rely on large regression test (RT) suites: each code change triggers more than 200 coupled model configurations across HPC platforms and compilers, compared against baselines. But a pass/fail comparison of output files tells developers only that something changed, not what or where. This is especially dangerous when a change in the answer is expected and a new baseline is accepted without close analysis, risking nonphysical results. Answering “what changed” usually means slowly downloading output and hunting through it by hand, which is especially challenging when multiple components participate.
GeoGate shortens that loop by making co-processing part of the RT itself. When enabled, it generates scientist-defined diagnostic plots of the exchanged fields and model state as the test runs, and performs automated quality control, checking that field values stay within physically plausible ranges and flagging missing or invalid data at the coupling interfaces, where subtle errors in a coupled system first appear. These artifacts can be pushed to a repository or cloud storage, so a failed test arrives with pictures attached: instead of a cryptic bitwise mismatch, a reviewer sees a rendered field and can often diagnose the problem at a glance.
To demonstrate this in a realistic operational context, GeoGate is integrated into the UFS Weather Model’s cpld_control_gefs regression test, a fully coupled configuration running UFS-ATM, MOM6, CICE6, WaveWatch III, and GOCART with the CMEPS mediator. With GeoGate added to the run sequence, the test produces Catalyst-rendered diagnostics of the exchanged fields alongside its normal baseline comparison, showing that in situ co-processing can be enabled in one of UFS’s most complex configurations without modifying any model component (Figure 6).
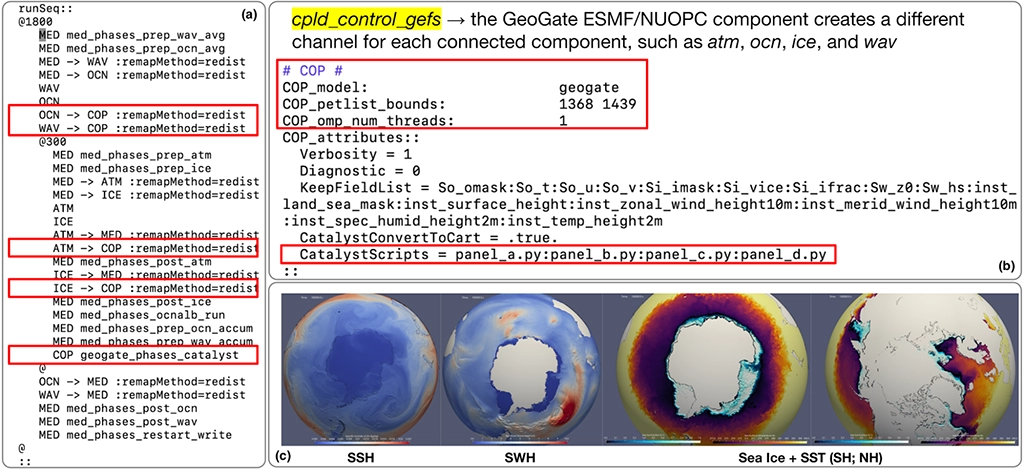
Figure 6. The GeoGate-integrated UFS WM cpld_control_gefs regression test: (a) the ESMF/NUOPC run sequence, (b) the GeoGate section of the ufs.configure file, and (c) visual outputs generated by ParaView Catalyst Python scripts (panel_a.py, panel_b.py, etc.).
Video 1. Visualization created by panel_a.py showing specific humidity at a 2-meter height.
We use the same machinery to test GeoGate itself. Two GitHub Actions workflows (one using EGL, one using OSMesa for headless rendering) build the full environment with Spack and run a two-component configuration in which CDEPS data components, fed with ERA5 wind and sea surface temperature, are coupled to GeoGate under ESMF’s generic ESMX driver. Every commit produces rendered plots as CI/CD artifacts, verifying not just that the code compiles but that the whole pipeline still produces correct images, making GeoGate one of the few in situ frameworks whose visualization path is continuously tested end-to-end.
Looking Ahead
GeoGate is still under active development. The near-term focus is extending the ParaView Catalyst integration itself: broadening mesh and grid support across UFS and CESM configurations (including MPAS unstructured meshes and native 3D fields), enriching the CI/CD-tested pipelines, and streamlining how scientists attach their own ParaView-exported pipelines to running systems. The harder challenge is dependency management: UFS WM builds against spack-stack, a curated stack of dozens of pinned libraries, and adding something as substantial as ParaView Catalyst is not trivial. Keeping GeoGate’s direct dependencies minimal and using Spack environment chaining to extend the validated stack rather than modify it has worked well, and containers (Docker or Singularity) are another promising route that could open the door to cloud resources. Further out, the same machinery supports genuine two-way workflows (computational steering, online feature tracking, and data assimilation), which will require extending ESMF/NUOPC for MPMD-style execution across mixed CPU/GPU resources, work we are pursuing with the ESMF team.
The broader takeaway is architectural. By placing in situ analysis at the coupling layer rather than inside individual components, a single Catalyst integration serves every ESMF/NUOPC-based model (from UFS WM regression tests to UFS Coastal’s high-resolution configurations), with data accessed in its native form, at zero copy cost, and without touching a single model component. As Earth system models push toward kilometer scale and AI/ML components multiply the data further, we believe generic, framework-level co-processing like GeoGate’s will shift from convenience to necessity.
GeoGate is open source and under active development on GitHub, and we welcome collaborators, whether you develop a NUOPC-based model and want to try in situ analysis with ParaView Catalyst, or work on in situ infrastructure and want an Earth-system testbed. We are grateful to Kitware for ParaView Catalyst and the CMake build system, and to the LLNL Conduit team for the foundation this work builds on.
Want to add in situ analysis to your simulation or coupled modeling system? Contact Kitware’s team of experts for development and support services, and fast-track your success with ParaView Catalyst.
Acknowledgments
This material is based upon work supported by the NSF National Center for Atmospheric Research, which is a major facility sponsored by the U.S. National Science Foundation under Cooperative Agreement No. 1852977. Computing resources were provided by the Climate Simulation Laboratory at NSF NCAR’s Computational and Information Systems Laboratory (CISL). The work is also supported partially through Task Order No. 1305M225F0249 entitled “Advancing Ufs Infrastructure In Support Of Coastal Coupling”, issued by the National Oceanic and Atmospheric Administration (NOAA) under IDIQ Contract No. 1305M222DNWWK0005. The authors thank Brian Dobbins, Ann Tsay, and the entire ESMF Team for helpful conversations and support.