LidarView 5.3: now connected to ROS2
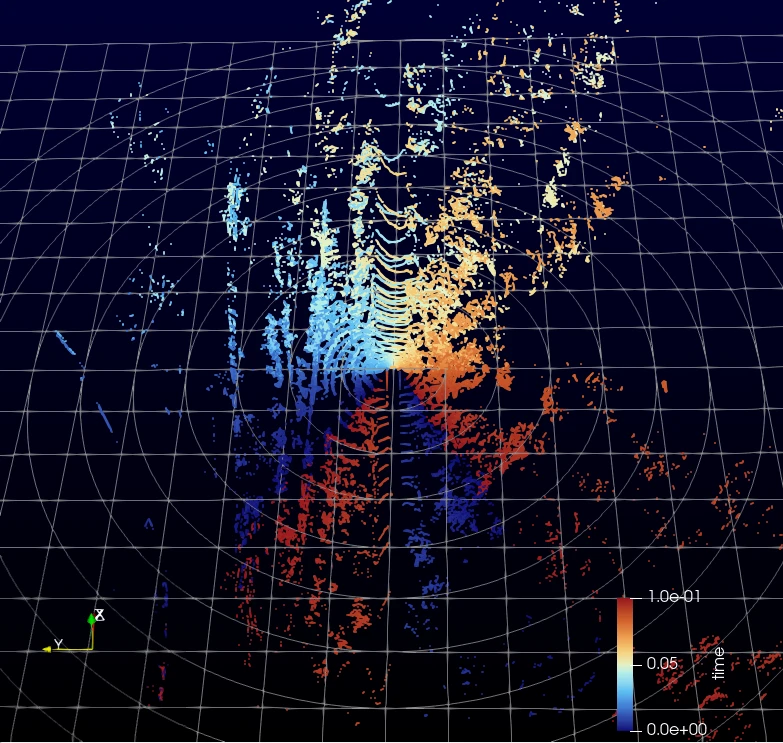
What’s new in LidarView 5.3?
Our latest blog post about LidarView announced version 5.0.
This was a major update, adding new functionalities (object detection, volume measurement…) and interfaces (simplified LiDAR viewer, initial trame applications, SLAM toolbar…).
- With LidarView 5.1, we introduced new filters (mainly for point cloud processing), as well as a rework of stream handling to optimize it.
- With LidarView 5.2, we added multi-sensor support in SLAM, new supported sensors, and enabled large scale map creation.
- In LidarView 5.3, we added Ouster sensor support, improvements to object tracking, major updates to georeferencing (check out our dedicated blog post for more details), as well as connection to ROS2.
In this blog, we will focus on this last point: what possibilities this brings to ROS2 users, but also for non ROS2 users, and go into the implementation details as well as the limitations of the approach.
Introduction to ROS2
ROS2 (Robot Operating System 2) is an open source middleware framework that provides a set of software libraries and tools widely used in robotics. It harmonizes interfaces and communication between different nodes, including sensor drivers, perception algorithms, planning tasks, and actuators.
Most nodes comply with the standard defined interface for the different data types. In our case, we focus mainly on the message types emitted by sensors (defined here for the Jazzy version)
It comes with a set of tools for data visualization, with the most widely used being Rviz2.
One issue with the ROS2 stack is its lack of portability and the need for a developer ROS2 environment to interact with data.
Also, advanced analysis is limited with the ROS2 native tools. Linking LidarView to the ROS2 environment enables more complex analysis and leverages built-in filters for data processing and visualization.
Recorded data (or ROS bags) contain the timestamped dataset extracted from each message transmitted by ROS2. Traditionally, the storage format was sqlite, with db3 file format. More recently, the MCAP file format has emerged and is becoming the standard, particularly because it offers higher write throughput (for a more complete comparison, see this article). Therefore, we focus on supporting the MCAP file format in LidarView for recorded data.
What can LidarView bring to the ROS2 community?
Below are several LidarView features that we think are potentially useful to the ROS community.
A way to share datasets with non ROS2 users
Installing ROS2 can be challenging for non-technical users or when operating on a computer with limited possibilities for the user to install software. LidarView can serve as a standalone application to share datasets with users who do not have ROS2 installed on their machine, and on the same network, it also allows remote monitoring of a stream.
Multi-Sensor Data Playback
This video shows playback of LiDAR, camera, and odometry data (recorded in an MCAP file) synchronized by their timestamps, alongside the application of a SLAM algorithm (implemented as a LidarView filter) on the LiDAR data. Currently, LidarView can read data from various sources via ROS messages and can easily be extended to support new message types. We also added publishers to enable two-way communication with other ROS2 nodes.
LidarView as a Data Analysis and Debugging Tool
This video demonstrates the use of linked selections between the 3D visualization and individual point values (in the spreadsheet view). This feature is particularly useful for exporting highly targeted data and/or verifying data in detail.
Below, we show how we can extract specific data to plot different parameters to analyze their interaction.
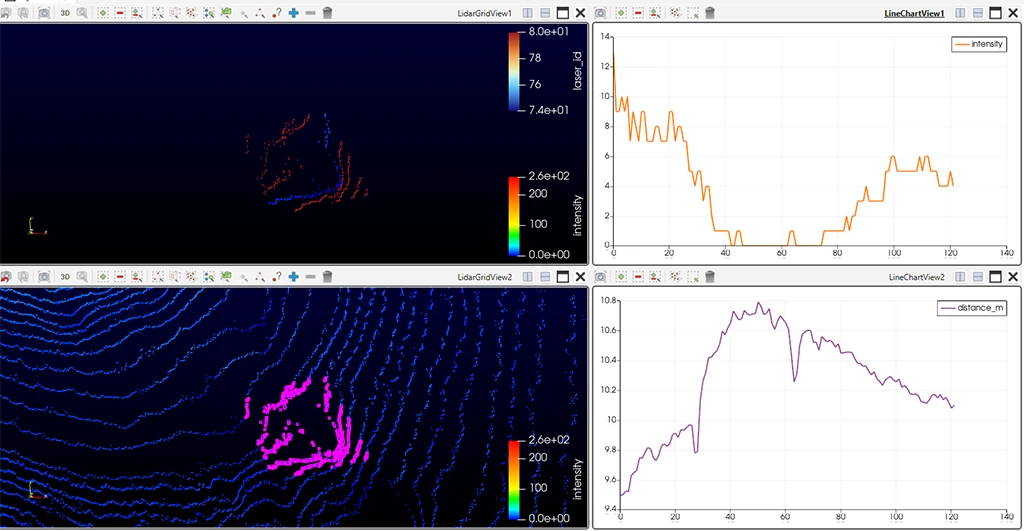
Example of analysis of strange distance pattern observed on the ground: We used the Selection extraction tool to focus on an area to analyze (bottom render view), then selected one laser only ( the blue one in the top view) and plotted, for that laser, the evolution of the distance against the intensity received by the sensor. In this case, it seems that a low reflective surface was lying on the ground, and LiDAR estimated biased distances in this region due to this.
Data Export in Various Formats
One of the core strengths of ParaView—and by extension, LidarView—is the vast number of 3D data formats supported for both import and export (including .las, .csv, .vtp, .pcd, .e57, etc.). This enables seamless interoperability with third-party software that only accepts specific formats. In particular, it allows you to save data in MCAP format when working with compatible structures.
Utilizing Built-In Application Filters
A major strength of the LidarView ecosystem is its extensive array of available filters. Examples include:
- SLAM: For trajectory estimation and 3D mapping (video showing its integration into the user interface).
- Object Detection:
- Multi-Sensor Calibration: In this blog post (specifically the section “The importance of calibration and how to refine it”), we demonstrate a dedicated filter for calibrating a sensor emitting poses with a LiDAR. LiDAR-to-LiDAR and LiDAR-to-camera calibration pipelines have also been developed
- Core ParaView Filters: For thresholding, downsampling, and extracting point cloud statistics (see this video), alongside various processing routines derived from the PCL library wrapped inside LidarView (see this blog post for more details).
Time-Series Value Plotting
The following example, taken from the documentation of our LiDAR SLAM library, shows curve plotting applied to the library’s confidence estimators: Documentation Link. In this specific case, the data comes from a .pcap file read by LidarView, but we could similarly use these outputs from the library’s ROS2 wrapper to visualize them in the exact same way.
Custom Data Processing
LidarView integrates a Python shell, allowing users to access data within the pipeline, instantiate filters to perform processing, and embed custom logic directly from the terminal. This can be leveraged to execute personalized, repeatable actions very quickly. Various examples—notably for instantiating filters, creating animations, and saving data—are available at this link. Additionally, a standalone executable (lvpython) allows these scripts to run headless (without launching the LidarView GUI), making it possible to run parallel processing on multiple datasets.
LidarView as a tool for quick prototyping
It offers an easy interface for custom filter parameters, allowing quick tuning and visual feedback when integrating your algorithm into the software. This is particularly useful when dealing with multiple parameters at the same time and needing visual feedback.
Build your own LidarView based application
LidarView is developed under the Apache 2.0 license, which allows derivative work to be exploited commercially. Numerous LiDAR manufacturers have derived their visualization applications from it, and any company developing its data processing algorithm and requiring a custom front-end interface for it can do the same, relying on the data replay and the visualization capabilities of LidarView.
As highlighted in one of our previous blogs, we can also create web applications that leverage LidarView’s capabilities using the trame framework.
Technical details
The connection to ROS2 in LidarView is performed through the Fast-DDS library, one of the DDS implementation layers of ROS2.
This is included in the ROS2-IO plugin: https://gitlab.kitware.com/LidarView/plugins/ros2-io
Below is a summary of the ROS2 architecture, with the connection made in the plugin.
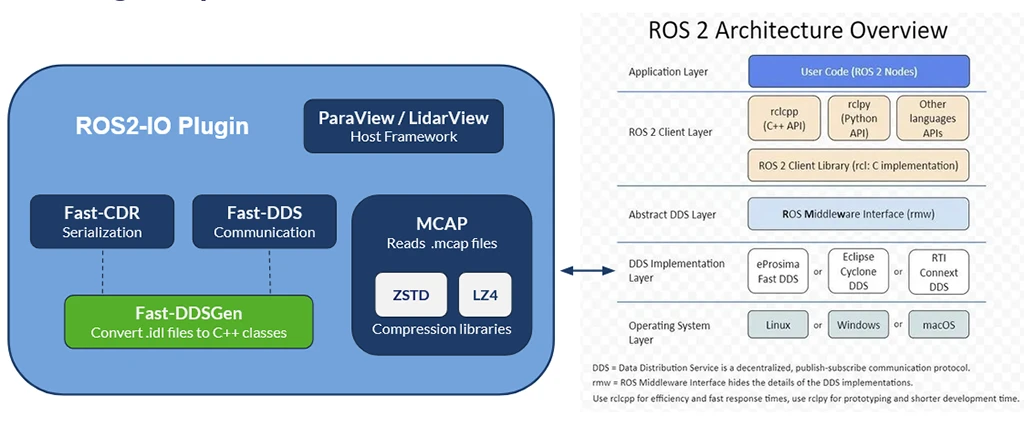
Figure illustrating the connection between LidarView and ROS2 ecosystem through the DDS layer
The connection is made on the lower level in order to avoid having to embed ROS dependencies and therefore skipping the ROS2 build toolchain and packages, making a cross platform package more easily.
The drawback, though, is that some ROS2 conventions (such as topic namings, QoS…) have to be replicated in the plugin, which requires keeping them aligned as they evolve in the ROS2 environment.
Also, ROS2 services and Actions are not supported in this mechanism.
At the time of writing, supported messages must be generated explicitly (we use Fast-DDS-Gen utility for that purpose) and conversions to and from VTK data model must be implemented, therefore, only a subset of ROS2 message types are supported (though any can be added in the future):
- For subscribers, it supports point clouds, images (raw and compressed), and tabular data (such as NavSatfix message)
- For publishers, only point clouds are supported (note: a SLAM trajectory may be represented as a point cloud, so it may be exported as a ROS2 topic from LidarView)
Feedback from the ROSConFR & ROSConUK
We have showcased LidarView at the annual regional ROS conferences held in France and in the United Kingdom in 2026.
It received positive feedback from the community, seeing it both as a tool for fine analysis of data contained in ROSBags (in particular for point clouds), but also as a tool for prototyping algorithms and adjusting their parameters interactively to monitor the results.
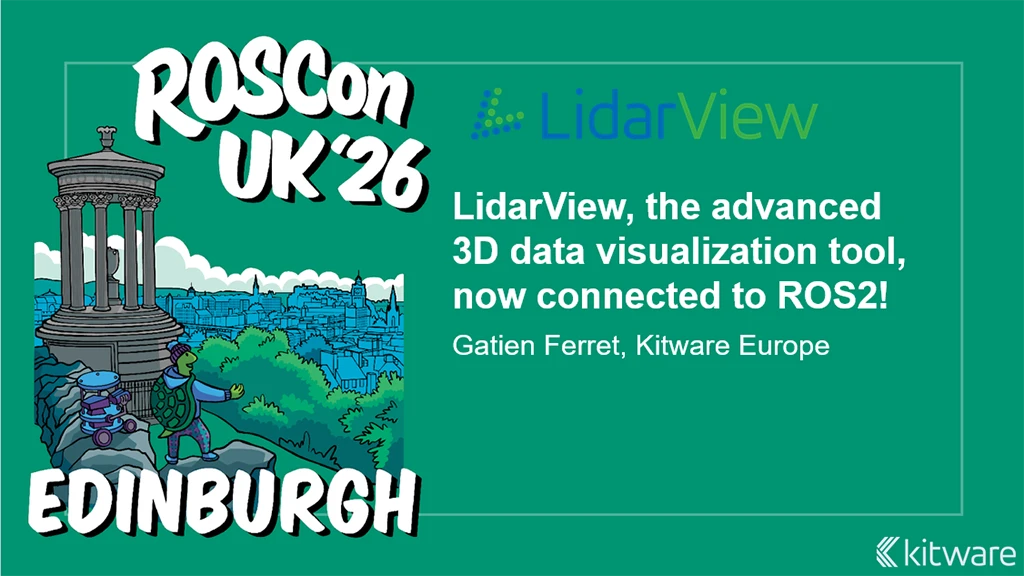
Main slides for both regional ROSCons
The slide deck presented at the ROSConUK conference is available at this link.
Conclusion
We think that LidarView can be a tool of choice for debugging and prototyping for developers in the ROS2 who require fine grained feedback on the data, the results of their algorithms, and a front-end application to show their work to non ROS2 users.
This is only the first step, as more and more data types can be handled, new functionalities may be added to interact more completely with the ecosystem, and additional algorithms used in robotics can be added and chained together to create custom pipelines easily before deploying them on the robot.
Contact us to let us know more about what usage you could make of this, and which new features can be useful for your work!