Monitor your Simulation in your Web Browser with trame and Catalyst
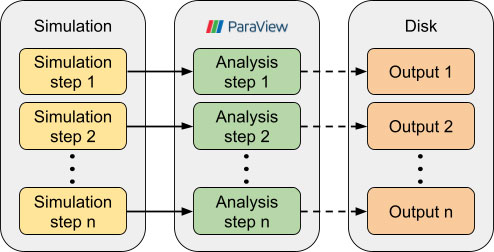
Live visualizing simulation data can be difficult and costly: the data needs to be saved to disk periodically to be analyzed in order to create meaningful images. What if you wanted to monitor your simulation across multiple devices without installing anything locally? What if you wanted to do all of that without spending hours saving simulation data on the disk? Let’s see how it can be done using Kitware’s technologies.
Trame is a Python framework for creating web applications with a few lines of code. A wide variety of trame widgets enables you to create rich interfaces. For instance, the trame-vtk module can be used to integrate ParaView using remote rendering.
Catalyst is an In-situ framework that allows you to perform analysis and visualization during a simulation, without suffering from any I/O bottleneck. Its main implementation, ParaView-Catalyst, lets developers visualize and analyze simulation data on every time step using ParaView’s rich collection of filters. You can learn more about ParaView-Catalyst in this guide.
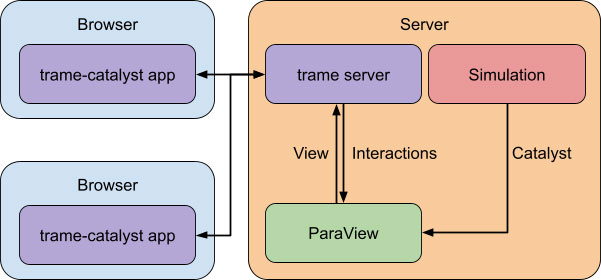
Meet trame-catalyst, a trame application for live visualizing simulation data sent through Catalyst. It can be a good alternative to the ParaView Catalyst live client. In fact, it features a simpler interface, as you can only see the raw data. Since this is a web app, it doesn’t require any client-side installation (other than a web browser), and multiple people can view the results simultaneously. What’s more, it uses remote rendering, so you can easily monitor your simulation from any device, without needing a powerful GPU on each client.
Showcase
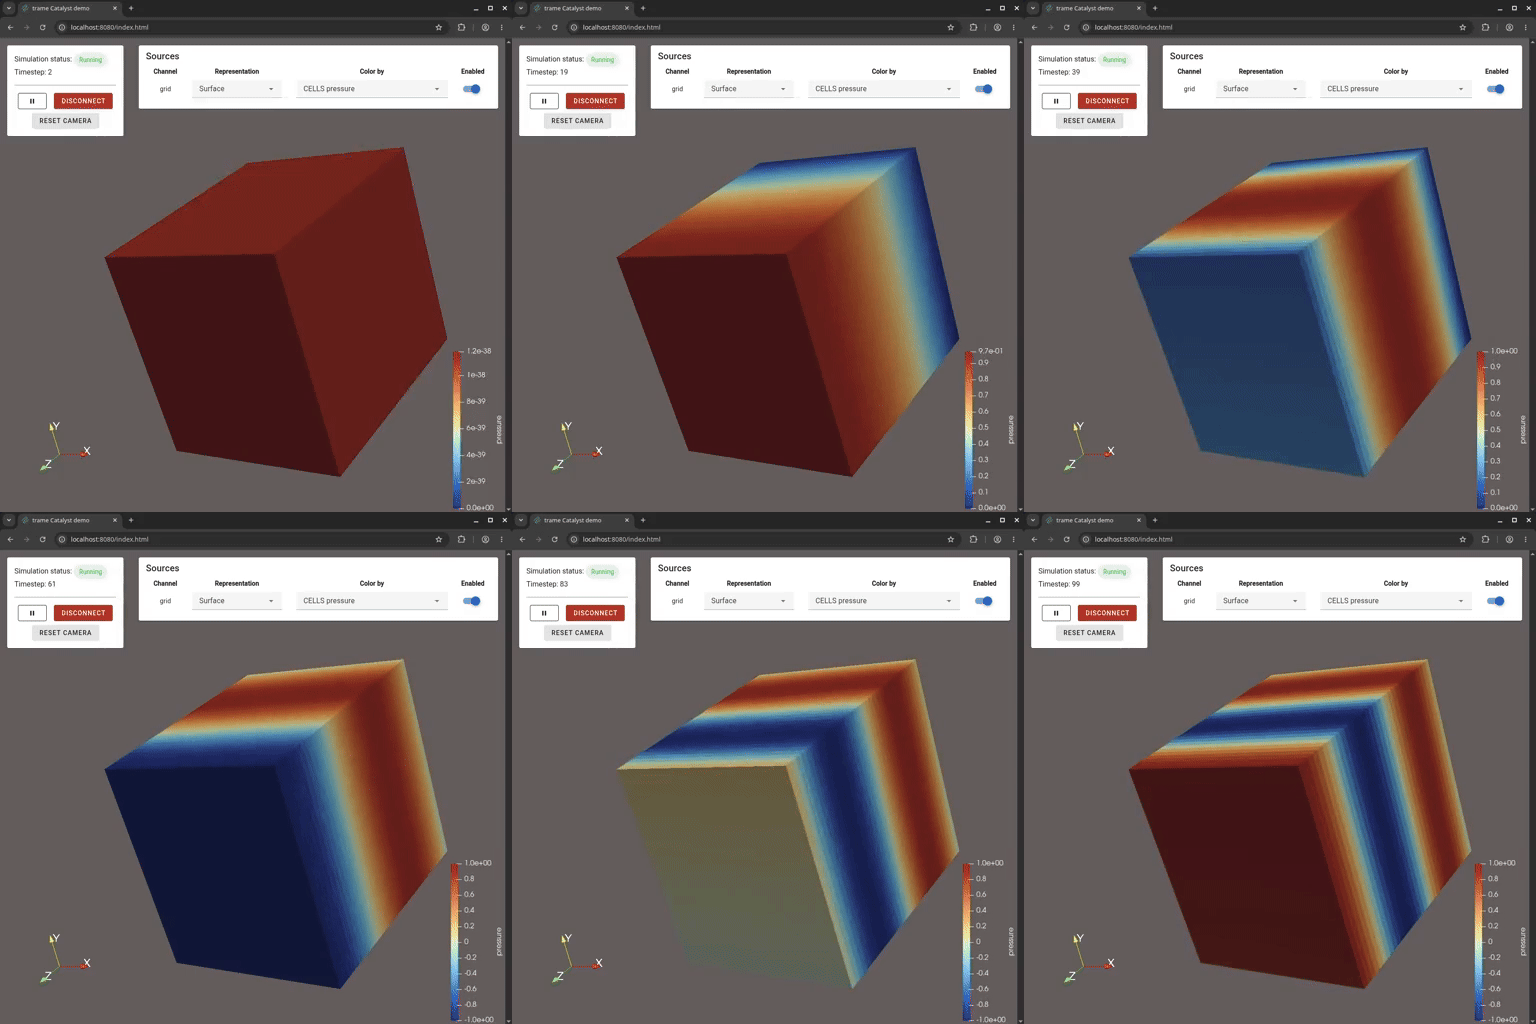
This app features a full screen ParaView remote view where the simulation data can be shown. On the left, you can find some information about the simulation (connection status, current time step) and play/pause, connect/disconnect, and reset camera buttons. When connected to a simulation, the simulation channels are listed on the right side, with combo boxes to adjust the representation and the color array.
Let’s try it out with two different simulations:
The first simulation is a toy particle simulation that you can find here. Simply launch the trame-catalyst app, and then launch the simulation. The application will automatically pause the simulation when it connects.
The second simulation is an example taken from the ParaView Catalyst examples repository and integrated into the trame-catalyst demo repository.
Try it yourself
You can try trame-catalyst with your own simulation by downloading the app from its repository!
Launch the application using PVPython from a ParaView release:
# Create venv
uv sync

# Launch the application
/path/to/paraview/bin/pvpython --venv .venv src/trame_catalyst_demo/app/main.py
In parallel, you can launch any simulation that uses Catalyst. If you don’t have any, you can launch the example included in this repository. To run the simulation, you’ll need to build Catalyst with the CATALYST_WRAP_PYTHON=ON CMake option.
# Download the extra python modules needed to run the simulation
uv sync --extra simulation

# Setup environment variables for the simulation
export CATALYST_IMPLEMENTATION_PATHS=/path/to/paraview/lib/catalyst
export PYTHONPATH=/path/to/catalyst/lib/python3.14/site-packages/

# Launch the example simulation
uv run src/trame_catalyst_demo/example/fedriver.py src/trame_catalyst_demo/example/pipeline.py
The app will automatically pause the simulation when it is connected. You can unpause it using the play/pause button.
Conclusion
Although this application can be used as-is, its main purpose is to demonstrate that visualizing simulation data live on the web is very easy with ParaView, Catalyst, and trame.
Looking to take your application to new heights? Contact our team of experts for development and support services, and fast-track your success with trame.