ParaView technique: Curved and nicely spaced arrow glyphs

ParaView has a number of great filters for generating visualizations of 3D vector fields. This post describes a recipe I learned from Russell M Taylor II at UNC’s Department of Computer Science. The recipe combines several of ParaView’s filters to produce curved arrow glyphs that are laid end-to-end at a good density in the image, resulting in improved perception of the vector field. The technique is inspired by the 2D vector field visualizaton technique Turk and Banks presented in their Image-Guided Streamline Placement paper at SIGGRAPH 1996.
This recipe can be used to generate images like this:
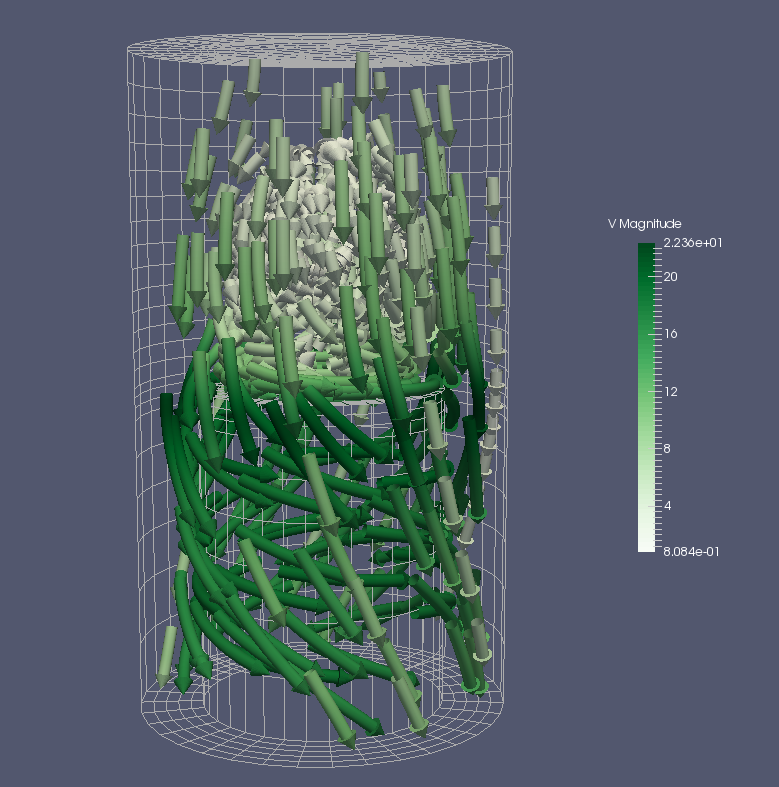
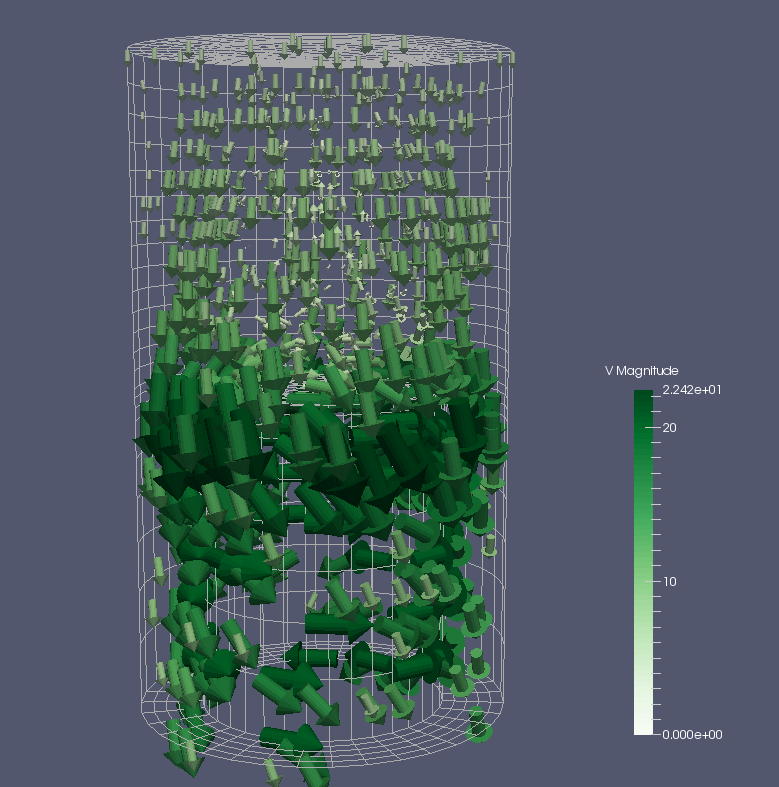
Compared to the image below created with the standard Glyph filter, the curvedness of the glyphs and their end-to-end alignment in the image above makes it much easier to visually trace along the vector field.
To create images like this, follow this recipe:
- Load data with a vector field array. Let’s assume the array is named Velocity.
- Add a Point Source from the Sources menu. Place the center of this source somewhere near the beginning of the vector field. Set the “Number of Points” to between 50-100. Adjust this number if the resulting image is overloaded with arrow glyphs.
- Create a Stream Tracer with Custom Source. Set the “Input” to the dataset you loaded in step 1 and the “Seed Source” to the Point Source created in step 2. Set the “Integration Step Unit” option to “Length”.
- Attach a Contour filter to the Stream Tracer with Custom Source created in Step 3. Change the “Vectors” option to “Velocity” and the “Contour By” option to “IntegrationTime”. Remove the existing value in the table under “Isosurfaces” and click on the insert range icon (below the minus sign). Change the number of “Steps” to somewhere between 50 and 100. Again, some tweaking might be needed to the exact number of steps to achieve the desired glyph density. This step gives you a set of points along the streamlines evenly spaced in integration time, which means points will be closer where the vector field magnitude is lower and less densely packed where the vector field magnitude is greater.
- Create another Stream Tracer with Custom Source with the “Input” set to the dataset loaded in Step 1 and the “Seed Source” set to the Contour filter. Change the “Vectors” option to “Velocity”, the “Integration Direction” to “BACKWARD”, and the “Integration Step Unit” to “Length”.
- Attach a Tube filter to the Stream Tracer with Custom Source from Step 5.
- Attach a Clip filter to the Tube filter in Step 6. In this step, we’ll clip the stream tubes by the “IntegrationTime” variable. Note that because the integration direction was backward, the “IntegrationTime” variable is non-positive. Change the “Clip Type” option to “Scalar”, the “Scalars” array to “IntegrationTime” and the “Value” option to -0.2. If the resulting tube segments overlap and appear as a single tube, adjust the “Value” property to a smaller number. If the resulting tube segments are spaced too far away, increase the “Value” property.
- Finally, attach a Glyph filter to the Contour filter created in Step 4. To get a cone at the end of the tube segments, change the “Glyph Type” to “Arrow” and the “Tip Length” to 1. To get the glyphs to match the size of the tube, or to be slightly larger, turn “Scale Mode” to off and adjust the “Scale Factor” to 1. If the cone is too long in comparison to its base, you might need to increase the “Tip Radius” and decrease the “Scale Factor” to squash the cones.
The end result should be an image similar to the top image above.
Note that there are a couple of limitations to this technique. If the tube segments are very short, the cones at the tips may overlap because their lengths are not changed. Variations of this technique could deal with this by changing the Contour filter in Step 4 to an array that gives the length of the streamline generated in Step 3, but then density would no longer correspond to vector magnitude.
The ParaView state file for the example shown here is attached CurvedGlyphs.pvsm. Note that the state file has an extension of “.txt” to work around security restrictions in WordPress. Please remove this extension after download. The state file requires the disk_out_ref.ex2 data file available here.
Gorgeous images!
Very awesome!
Doesn’t work.
1) Contour Vectors has no vector field
2)field in Stream Tracer with Custom Source #1 if locked on the only vector data source.
3)Scalars field in Clip filter is empty and has no options to select from.
s a result, the only vector drawn is the fixed source point.
Either ParaView has accumulated to many unfixed bugs in ver 5.5.0, or this manual is inconsistent.
The Contour output is used as the seed source for the second Stream Tracer With Custom Source filter. Make sure you select the original data with the vector field first, then the Contour second, then apply. See Step 5. If you have already set up the Stream Tracer source, you can right-click on the source, select “Change Input…”, and set the “Input” to the data set with the vector field and “Seed Source” to the Contour.
That should be fine. It’s the same case in the example in the post because there is only one vector field in the data set (‘V’).
Try to fix 1 first, then see if this resolves your third issue.
I just ran the example in the blog post and it worked fine in ParaView 5.5.0, so neither is the case.
Hi! Thank you for reply. But I still do not see the described options there
You forgot to mention something important, or the instructions are not exact.
It seems, I can not post here a link to the screenshot.
Try to deobfuscate this text using common sense:
pasteboard. co / Hu4i8b4 png
Cory, can this be done just using VTK. Do you have a c++ version?
Bill Lorensen
Sure it can be done in VTK. I do not have a VTK example of it, though.
Dear Corry
Can you please show screenshots of your filter stack, and some major configuration options? No matter how I try, I can not reproduce your results on vector field point 3D rectagrid.
OH! I think, I understand the core of the problem with this approach.
It works only on fluid dynamics with velocity vectors ONLY.
I was applying stream-trace blindly, but after examining, I see that it is incapable of connecting locally static fields in moving coordinates (locally). I mean, Electric, or magnetic field of the wave, traveling in free space. On short distances, it is just a static field with moving coordinates. So you can not trace the vectors it time. Moreover, they are orthogonal to motion. It is possible connecting the vectors, because the field is continuous in free space, and when passing dielectrics. But it looks, I need some other tracing algorithm, instead of StreamTracer.
In step 4 you say to “attach a contour to the Stream Trace…”
How do I attach a contour to this? I think a video would be much more useful. I can add a contour, but I am not sure what is meant by attaching the contour to another object.