Practical Use Cases for TTK
Topology ToolKit (TTK) is an open-source library for topological data analysis, which provides some useful insights to visualize and explore complex data.
Topology focuses on the study of shapes and connectivity within data, regardless of geometric distortions. In other words, topology helps you discover and quantify features like peaks, valleys, and connecting regions.
TTK is integrated with ParaView via a third-party plugin and is also available with VTK or direct C++ API. To get started with TTK and learn more about installation steps, tutorials, visit the official TTK website. You can also check out our previous blogposts on the subject.
In the following, we will show and describe some practical example use cases of TTK.
Geological Data Exploration
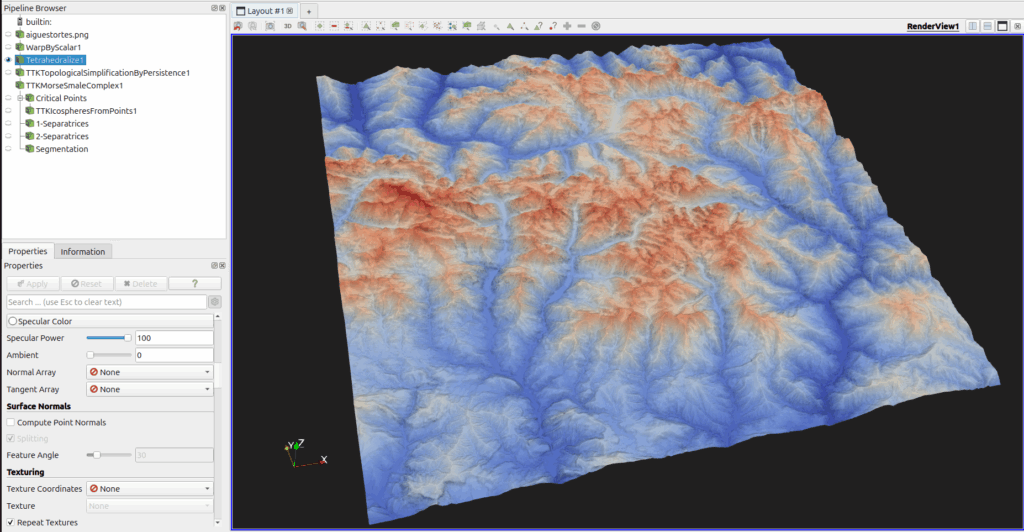
Fig1. Scalar field representing a terrain height field.
Visualization goal:
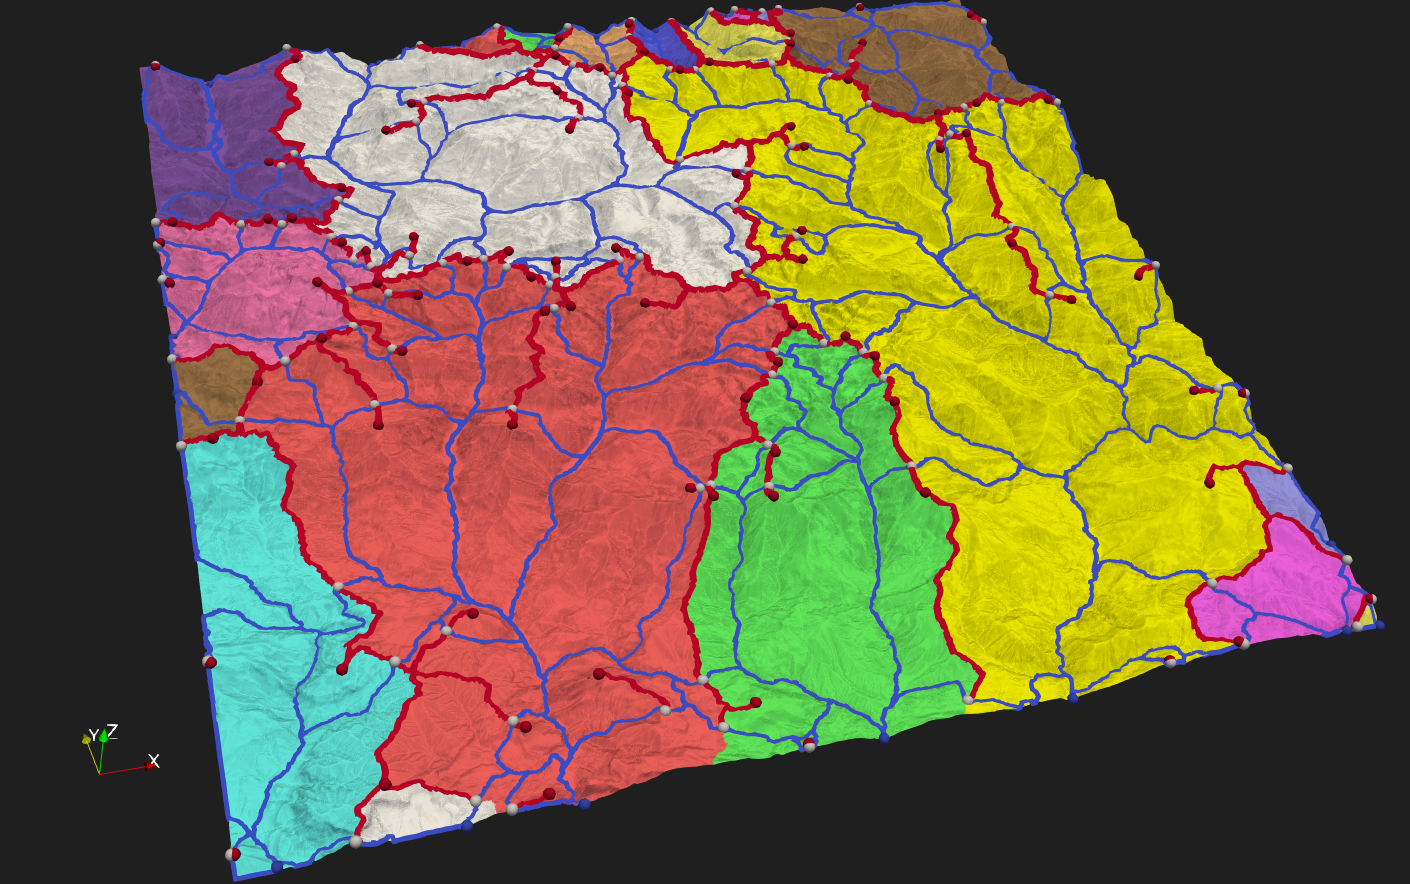
One of the most straightforward use cases for TTK is geological analysis. Topological analysis requires a scalar field to work on. In this context, the scalar field of interest is typically the terrain elevation. This allows us to identify and classify critical points such as peaks and pits, segment watershed boundaries and highlight ridges and valleys, which are essential to understand the terrain structure. The main application objective here is to estimate water runoff zones. In Fig2., each colored region corresponds to the area feeding the river web in blue, while red paths show ridges.
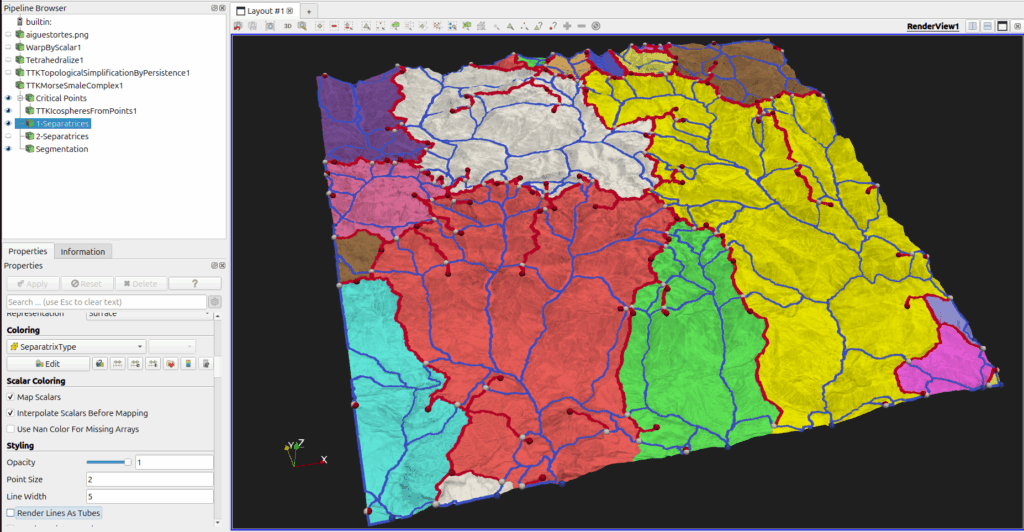
Fig2. Final topological analysis on the terrain highlighting critical points and segmentation the watershed boundaries. Here, valleys are in blue, ridges in red and spheres represent peaks.
Pipeline:
The pipeline begins with some preprocessing steps. First, the WarpByScalar filter is applied to translate points of the mesh according to its height field. Note that this step is purely visual and does not affect the topological computations. Next, the Tetrahedralize filter is used to convert the dataset and ensure the mesh contains only valid cells.
The core of the analysis begins with the TTKTopologicalSimplificationByPersistence filter. It basically modifies the scalar field according to a persistence threshold of topological features. Topological features are peaks, pits and saddles in the terrain, visualized as spheres in Fig2. By simplifying it, users can focus on the most significant structures while ignoring less relevant variations like small bumps.
Finally, the TTKMorseSmaleComplex filter to segment the data and extract features. In particular, it allows us to visualize the critical points, the ridges and to segment watershed boundaries.
Takeaway:
If your data is defined by a scalar field, such as elevation in topography, pressure in fluid simulations, or intensity in medical imaging, TTK can help to visualize extrema and their connections in such fields.
Fracture analysis
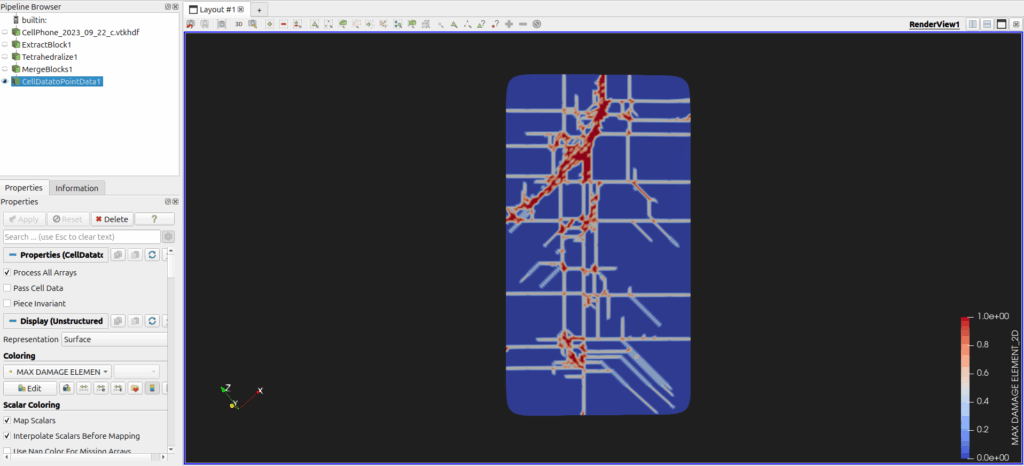
Fig3. Initial field depicting the fractures of a phone screen.
Visualization goal:
In this example, simulated with OpenRadioss, the dataset represents the propagation of cracks of a phone screen upon impact. The scalar field of interest is the fracture pattern itself. Our goal is to track the evolution of this fracture over time, more precisely, to measure the size of each individual fragment of broken glass. In Figure 2, we display the evolution of the average, minimum, and maximum fragment sizes in time.
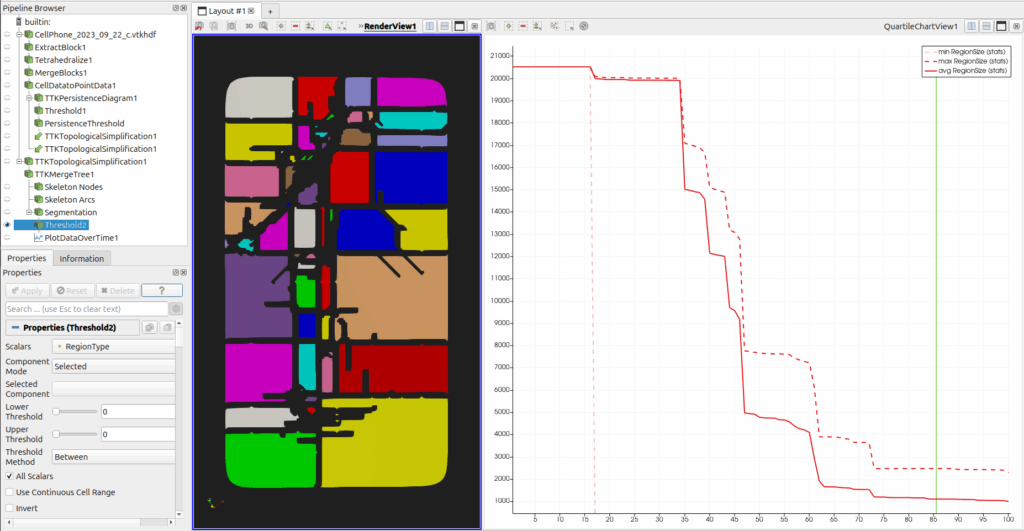
Fig4. On the left, the broken glass pieces segmentation. On the right, the evolution over time of the average, min and max size of pieces.
Pipeline:
The preprocessing steps are similar to those in the terrain example, ensuring that the data is in a format suitable for topological analysis. The workflow begins with the TTKPersistenceDiagram filter to identify and quantify the critical structures of the fracture field. As before, thresholding is applied to remove low-persistence features, followed by TTKTopologicalSimplification to apply these simplifications to the scalar field itself.
The novelty here lies in the use of TTKMergeTree. A merge tree provides a way to track the connectivity of components in the dataset. This filter not only outputs the tree structure but also segmentation information. This allows to segment each screen fragment and to require some information like their size.
Finally, the segmentId output is rendered, showing the spatial distribution of each fragment; alongside a graph showing the evolution of average, minimum, and maximum fragment sizes over time.
Takeaway:
If your dataset involves disconnected regions embedded in a scalar field, TTKMergeTree allows you to identify and segment such fields.
Manifold correctness
Visualization goal:
Many applications like simulation computation require a clean manifold mesh to work on. However, some meshing algorithms or complex pipelines don’t always guarantee the manifoldness of the output. For example Numerical Simulation of complex objects requires that mesh should follow closely the geometry. These meshes are very tedious to generate and it sometimes leads to non-manifold cells which would affect the simulation convergence, the result correctness and the visualization.To illustrate this case, we use the Motorbike model from the OpenFOAM tutorials. The mesh has been generated by the SnappyHexMesher which unfortunately generates some invalid cells that we would like to identify.
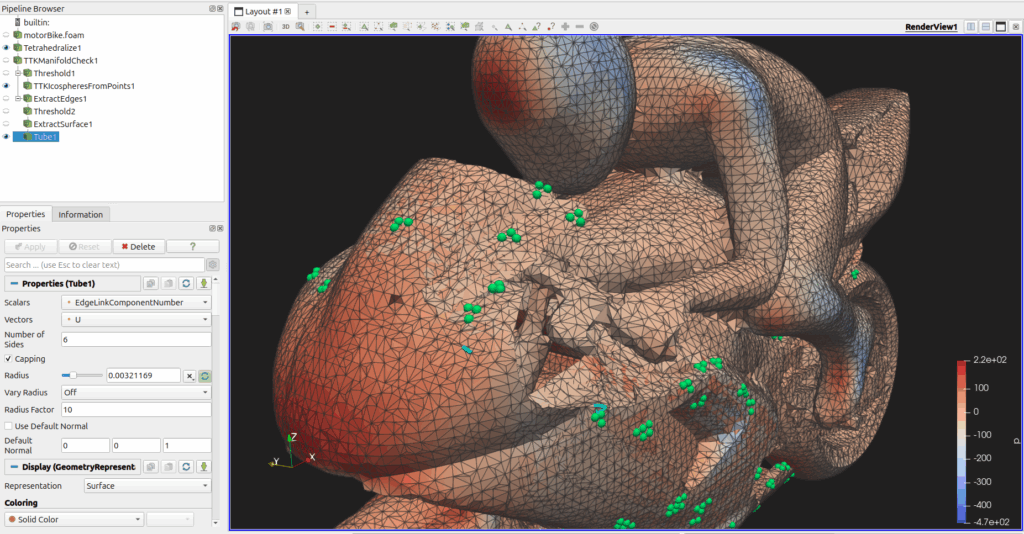
Fig5. Illustration of TTKManifoldCheck to show non manifold points (green) and edges (blue).
Pipeline:
The main filter is TTKManifoldCheck, which adds new data arrays Vertex, Edge and Triangle LinkComponentNumbers. You can then threshold those fields to extract the non manifold elements. This straightforward pipeline can help to quickly visualize which parts of the mesh may require cleaning.
Takeaway:
You can use TTK as a manifold checker to ensure the compatibility with some software, including ParaView filters.
Conclusion
The TTK library is a powerful toolkit that provides new insights into data by offering a topological perspective, complementing more traditional analysis methods. Beyond the examples we have shown here, TTK supports a wide range of applications such as point cloud processing, clustering, or tracking critical points over time and more.
We hope these practical use cases have inspired you to explore your own data! If so, download ParaView, load the TTK plugin and give it a try. Then reach Kitware to get help to integrate these tools in your workflow.