Tomviz 3.1: Animation, Advanced Rendering, Label Maps, and Live Updates
We are pleased to announce the release of Tomviz 3.1. Tomviz is a free, open source, cross-platform application for the reconstruction, visualization, and analysis of 3D tomographic data, developed openly on GitHub and distributed under the 3-clause BSD license.
Tomviz 3.0 rebuilt the application around a node-based pipeline. Tomviz 3.1 brings a significantly improved Animation Helper, advanced volume rendering, and a new Label Map visualization for exploring and cleaning up segmentations. Pipelines can now also update live while data is being acquired, and new transforms filter data in Fourier space.
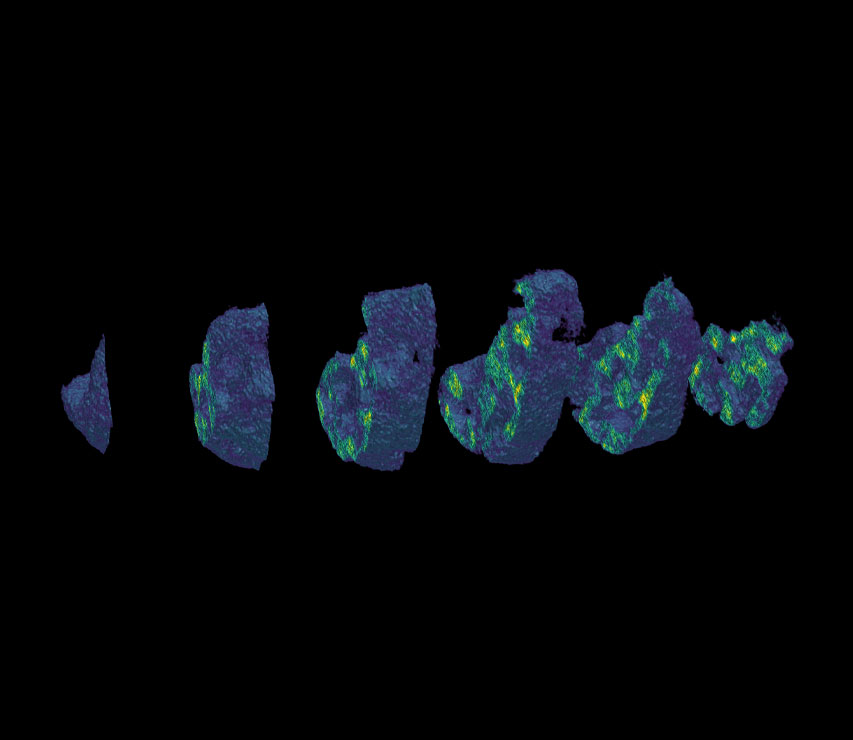
Featured Image: A PtCu nanoparticle split into slabs with the new exploded view. The data itself is unchanged.
Animate Your Data
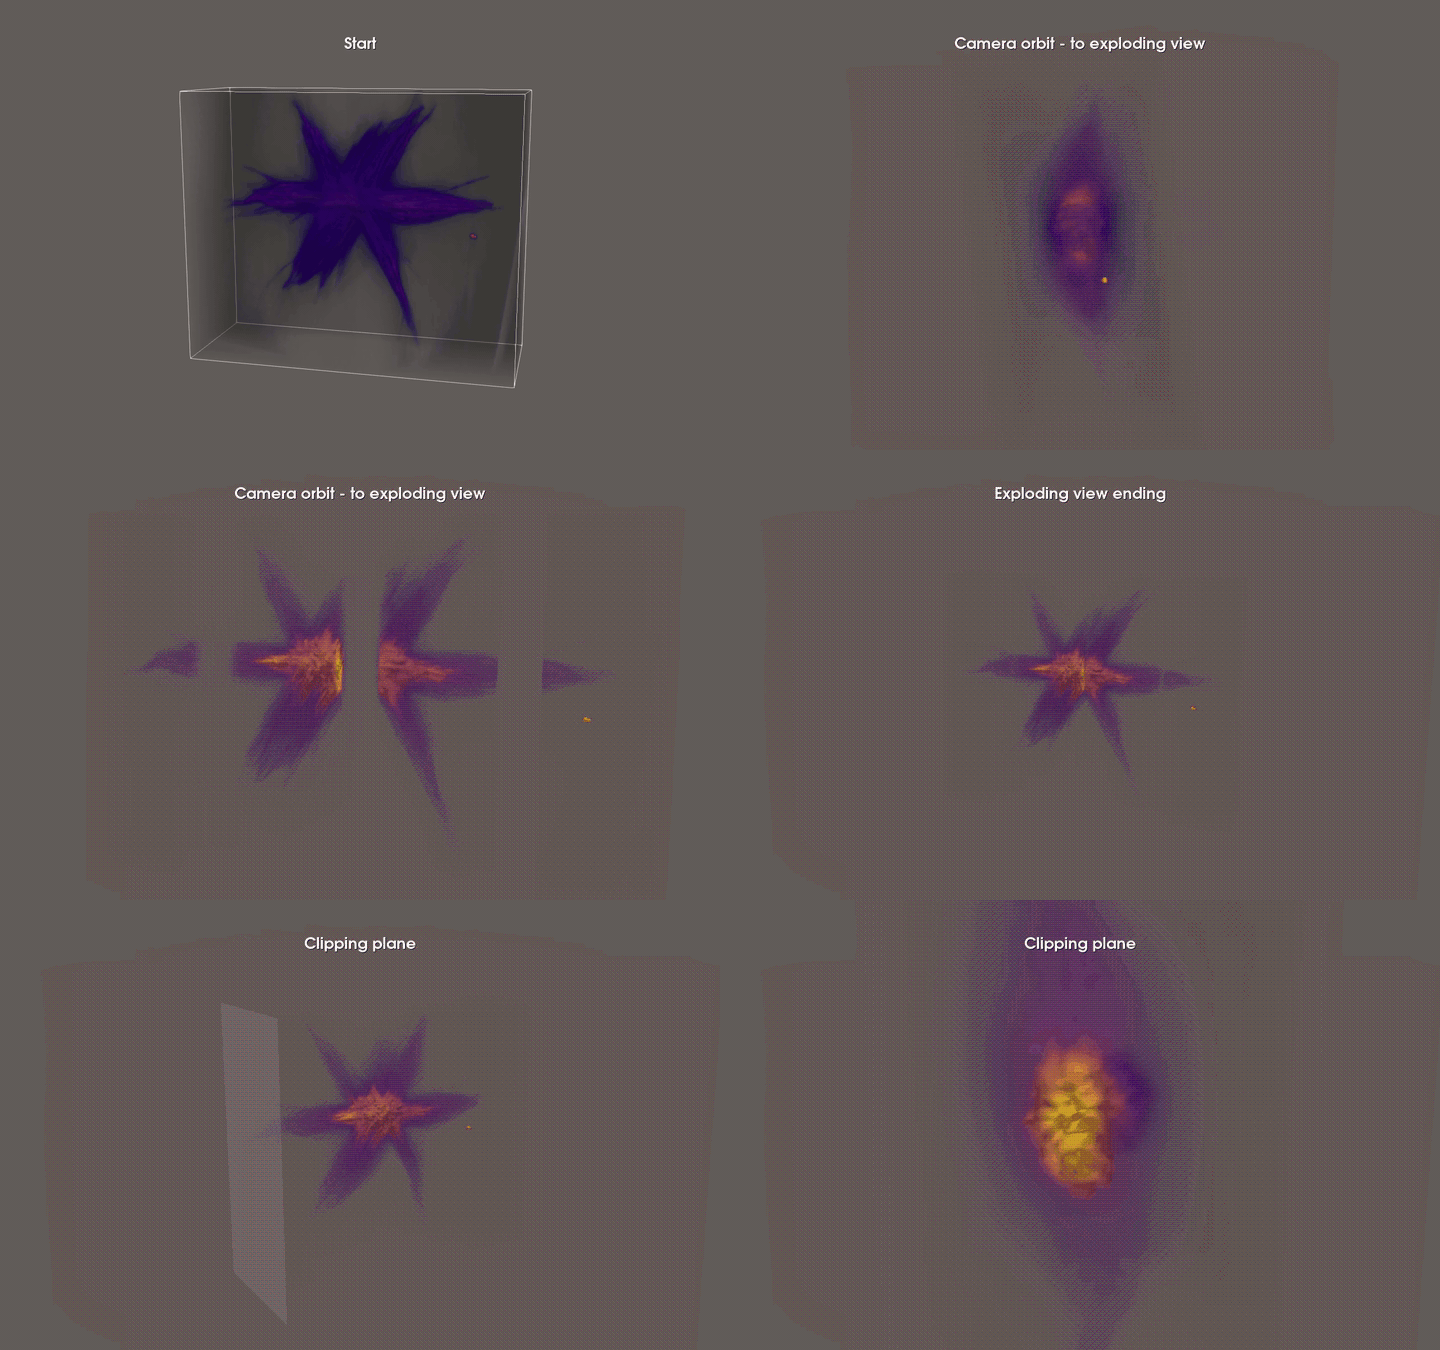
The Animation Helper has been significantly improved and now has its own Animation menu. Save a few viewpoints, and the camera flies between them, with optional orbits, easing, and on-screen captions. Each viewpoint can also record the state of your visualizations, such as opacity, slice and clip positions, threshold values, hidden labels, and cut-out or exploded views, and any changes animate along the way. Movies export directly to MP4.
Advanced Volume Rendering
Volume rendering gains new ways to light your data and see inside it:
- Lighting presets, from unlit to full volumetric shadows, plus custom presets you can save and reuse.
- Cut-out views hide one corner of the volume to show its interior.
- Exploded views split the volume into slabs and pull them apart.
- Several volumes in one view blend correctly, each with its own color map and opacity.
- Opacity presets and auto contrast over a region you select.
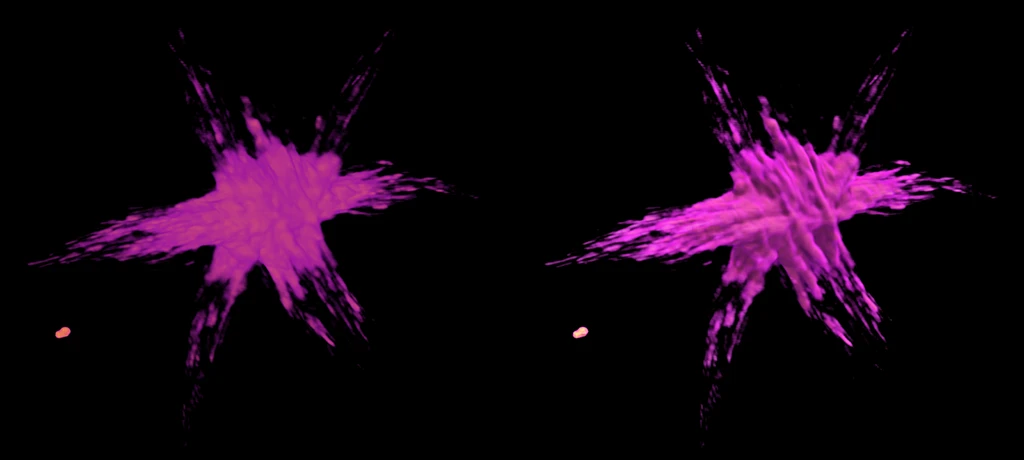
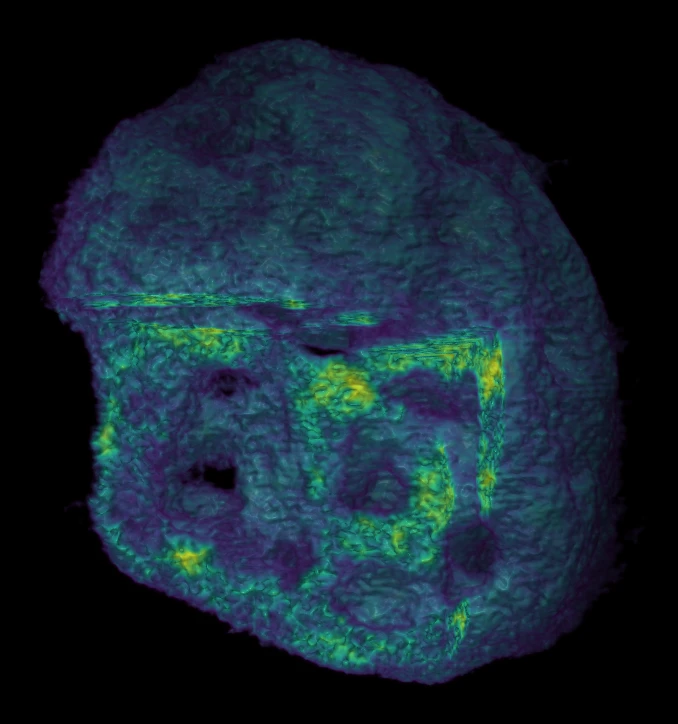
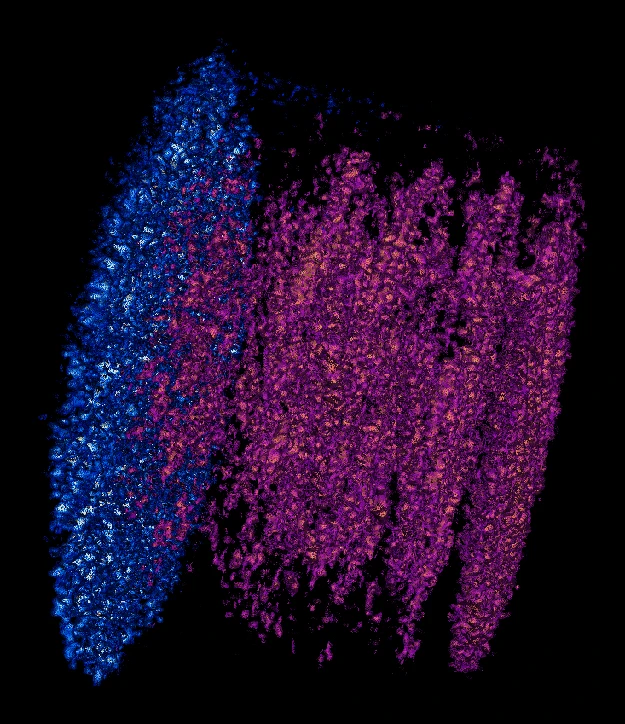
Left: a cut-out view of a PtCu nanoparticle. Right: tungsten (blue) and copper (magenta) XRF maps of an integrated circuit, rendered as two volumes in one view.
Live Updates During an Experiment
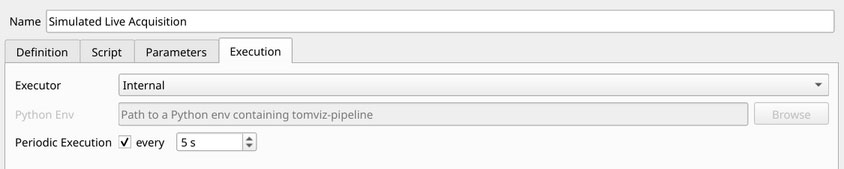
Pipelines can now keep up with data as it is acquired. With periodic execution turned on, Tomviz checks a Python source for new data at a set interval and re-runs it, along with everything downstream, so you can watch a reconstruction sharpen as projections arrive. Real-time reconstruction was first demonstrated in Tomviz for electron tomography (Schwartz et al., Nature Communications 13, 4458, 2022), and Tomviz 3.1 now provides it as flexible, extensible infrastructure that any Python source can build on.
To try it without an instrument, choose Sample Data > Simulated Live Acquisition, which is designed as a starting point for building a live source for your own instrument. The PyXRF and ptychography sources, built specifically for X-ray fluorescence and ptychography workflows at NSLS-II, are two more examples: they add new scans as they complete.
Segmentation and Label Maps
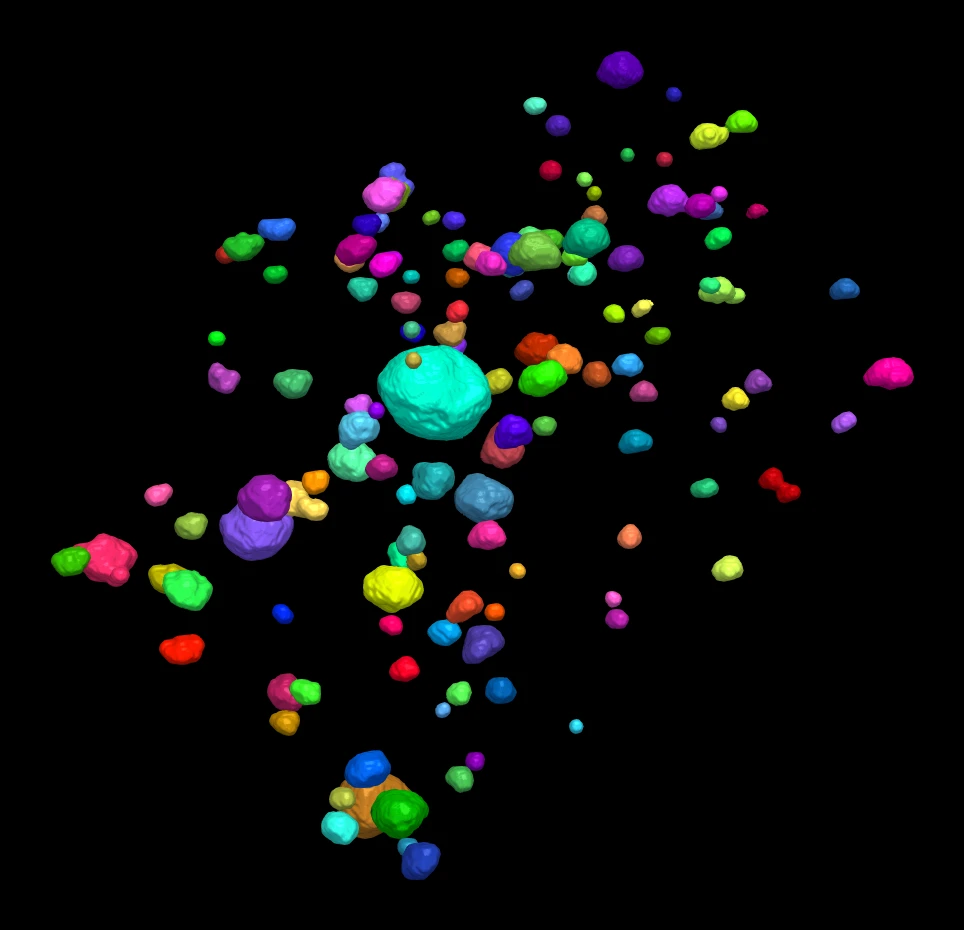
The new Label Map visualization shows each label of a segmentation in its own color, as smoothed surfaces or as a volume, and stays responsive with tens of thousands of labels. You can show or hide labels one by one, and the Animation Helper can reveal them as the camera moves.
Segmenting is easier too. Binary Threshold followed by Connected Components is one route to a segmentation, and the sliders of Binary Threshold are now linked to the Threshold visualization, so you can watch the 3D view update interactively as you choose values. To clean up the result, the new Remove Labels transform starts with exactly the labels you hid in the Label Map. Thresholding, connected components, and binary morphology now run on NumPy and SciPy.
Working Across Modalities
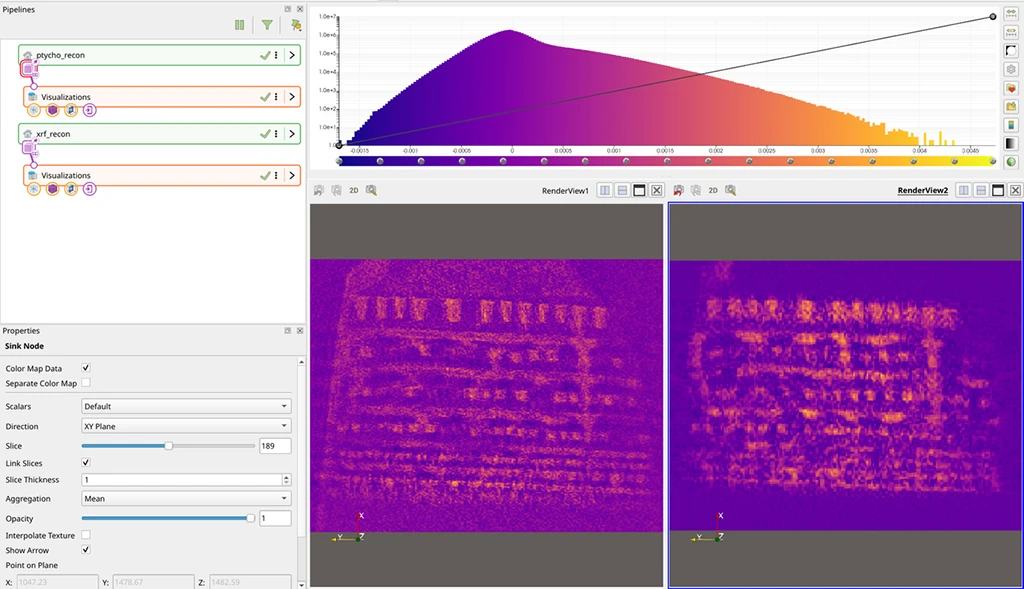
Slices and clips can now be linked across datasets and matched by physical position, so XRF and ptychography reconstructions of the same sample stay in register despite their different resolutions. Any render view can also switch to a 2D image viewer.
New transforms combine datasets: Image Math works voxel by voxel, even across resolutions, and Combine Datasets merges arrays into one dataset. Manual Manipulation and Elastix-based Registration are also back for aligning one volume to another.
Fourier-Space Filtering
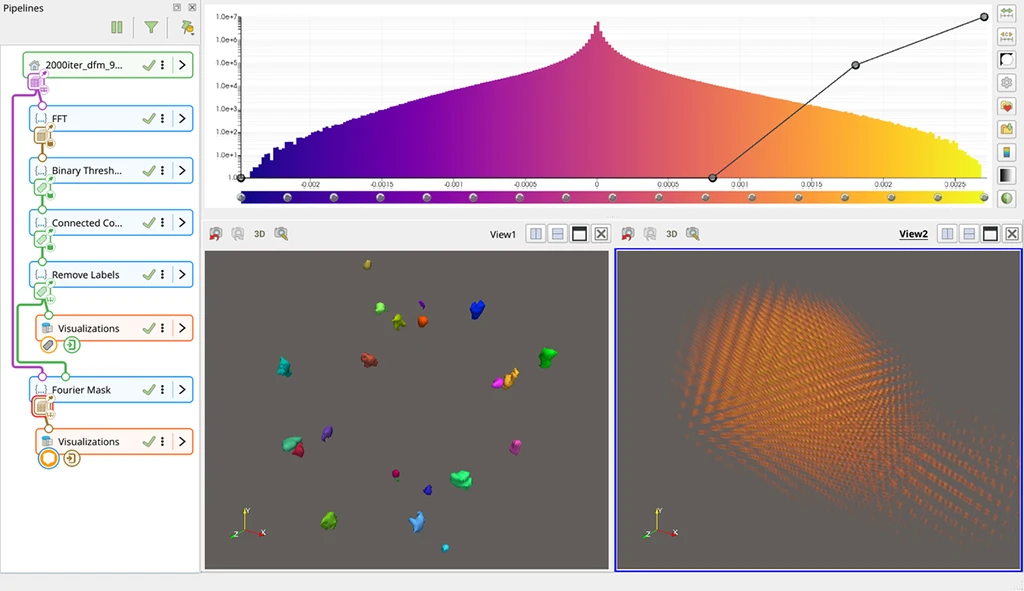
Three new transforms filter data in Fourier space and return real-space results: Fourier Filter (low, high, and band pass), Fourier Peak Mask, which automatically finds peaks and keeps only their neighborhoods, and Fourier Mask, which keeps whatever a mask volume covers. The mask can be made from the spectrum itself: on an FFT branch, use the Binary Threshold, Connected Components, and Remove Labels workflow described above to select the peaks you want, so the whole process lives in one pipeline.
A Standalone Pipeline Package
The pipeline engine is now a standalone Python package, tomviz-pipeline, that installs from PyPI or conda-forge. It runs saved pipelines in batch from the command line or Python, and any Python environment with it installed can run Tomviz transforms outside the application. Tomviz now checks such an environment as soon as you select it and shows the install command if anything is missing.
pip install tomviz-pipeline
tomviz-pipeline -s pipeline.tvsm -o results/ --input 'data/*.emd
Also New in 3.1
- Custom transforms can be created, edited, and managed from the Custom Transforms menu.
- Linux packages: an RPM for RHEL 8 and 9, and a Flatpak.
- Python 3.14 is supported and included in the installers.
What’s Next
Work continues on the trame-based web version of Tomviz, built on the same pipeline design and tomviz-pipeline package, for remote and in-browser analysis.
Try Tomviz 3.1
Tomviz 3.1 is available for Linux, macOS, and Windows from tomviz.org/downloads. Documentation, with new tutorial videos and a gallery, is at tomviz.readthedocs.io, and the source code is at github.com/OpenChemistry/tomviz. If you use Tomviz in your research, please cite J. Schwartz et al., “Real-time 3D analysis during electron tomography using tomviz,” Nature Communications 13, 4458 (2022). For help applying Tomviz to your data, or to collaborate on new capabilities, contact Kitware.
Acknowledgments
The Tomviz project was founded as a collaboration between Kitware, Cornell University, and the University of Michigan under DOE Office of Science contract DE-SC0011385. The tomviz-pipeline package, which implements the multi-input/multi-output pipeline design, was developed under DOE SBIR Phase II award DE-SC0024765, “Multivariate Volume Visualization and Machine-Guided Exploration in Tomviz,” and will also power the upcoming web version of Tomviz. The desktop features in this release were funded by Brookhaven Science Associates under the Statement of Work “Extending Tomviz for Synchrotron Tomography” in support of NSLS-II at Brookhaven National Laboratory. We thank Aaron Michelson for permission to show the gold nanoparticle superlattice data.