trame-flow: Interactive flowcharts for your trame application
The trame Python framework enables developers to create fast and reactive web applications. You may have seen that OpenFOAM can be configured interactively using trame, thanks to rich components in the trame ecosystem such as forms and VTK/ParaView 3D views. But what if you had multiple solvers that you want to configure, with a complex simulation workflow in which a solver could use the output of another solver? In order to have an intuitive interface, you’ll need to let the user organize the simulation workflow as a flowchart.
trame-flow is a new trame widget that wraps VueFlow, a Vue-based library for interactive flowcharts and graphs.
Thanks to its customizability, you can design your own graph nodes using other trame widgets. Let’s see how to install and use trame-flow in your application.
Installation
trame-flow is available on PyPI. Install it with pip install trame-flow or add it as a dependency to your project with uv add trame-flow.
Usage
To use trame-flow in your trame application, import the module and add the NodeEditor widget in the UI.
from trame_flow.widgets.flow import (
    Background,
    Controls,
    NodeEditor,
)

# Place the NodeEditor widget inside your UI
def build_ui():
    with NodeEditor() as self.flow:
        Background(gap=10, size=1, pattern_color="#81818a")
        Controls()
Then, you can create nodes programmatically using the create_node helper function. Three node types are defined by default: default, input and output.
from trame_flow.module.core import create_node
self.flow.add_node(
    create_node(
        id="0", # don't forget to increment node ids !
        x=0,
        y=0,
        type="default", # could also be "input", "output", or a custom type
        label="Node A",
        style={"background-color": "lightblue"}, # optional: custom CSS
    )
)
You can use the create_edge helper function to create connections between nodes, or you can let the user do it. When the user connects two nodes, the corresponding edge is created. You can override this behavior by setting a callback for the connect event.
def on_connect(self, connection: dict):
    # check that this connection is allowed
    # then create the edge
    edge = create_edge(
        source_id=connection["source"],
        target_id=connection["target"],
    )
    self.flow.add_edge(edge)

self.flow.connect = (on_connect, "[$event]")
The node and edge lists can be accessed with self.flow.graph. If you need to synchronize the graph in the state, you can set a callback for the graph_change event.
def on_graph_change(nodes, edges):
    with self.state:
        self.state.nodes = nodes
        self.state.edges = edges
    self.state.dirty("nodes")
    self.state.dirty("edges")

self.flow.graph_change = on_graph_change
Use case
Now, let’s see how we can use trame-flow to connect solvers to configure a complex simulation. First, define every custom node that you will need in your graph.
from trame_flow.widgets.flow import (
Background,
Controls,
CustomNode,
Handle,
NodeEditor,
)
def build_ui():
with NodeEditor() as self.flow:
Background(gap=10, size=1, pattern_color="#81818a")
Controls()
with CustomNode("solver1"):
Handle(type="source", position="right", id="out1", style="top: 10px")
Handle(type="source", position="right", id="out2", style="top: 20px")
Span("Solver 1")
with CustomNode("solver2"):
Handle(type="source", position="right")
Handle(type="target", position="left")
Span("Solver 2")
with CustomNode("solver3"):
Handle(type="target", position="left", id="in1", style="top: 10px")
Handle(type="target", position="left", id="in2", style="top: 20px")
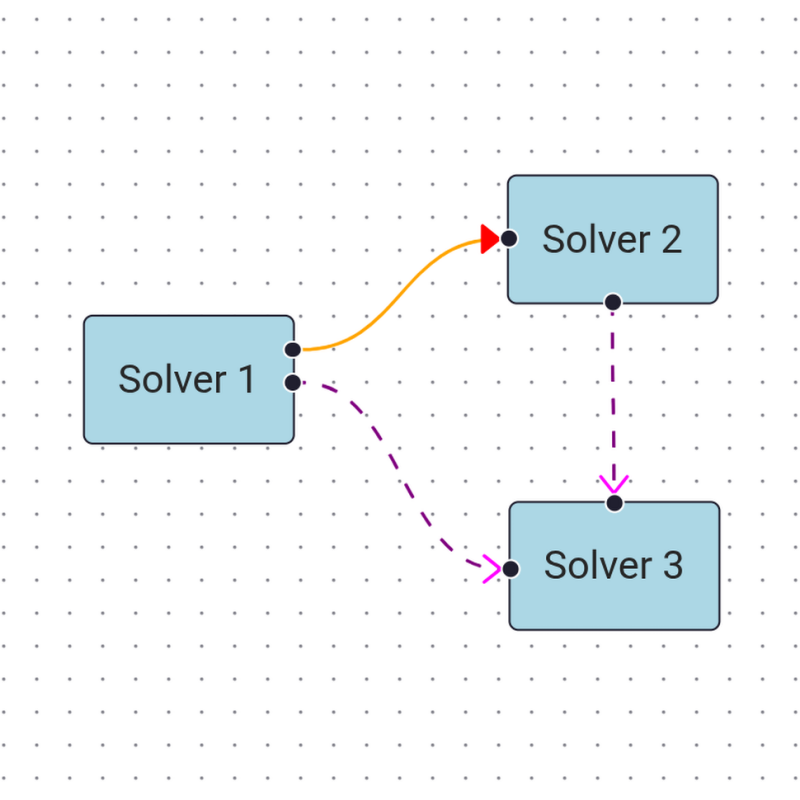
Span("Solver 3")Here, we’re defining three node types that correspond to three types of solvers. We’re also defining how many node handles we want for each node type. For each handle, we must define its type (“source” for output, “target” for input) and its position ("top", "bottom", "left", "right"). If a node has multiple handles of the same type, you must give the handles an ID.
Finally, you can get the list of edges with self.flow.graph[“edges”] or directly from the state with self.state.edges, that will look like this:
[
    {
        "source": "0",
        "target": "1",
        "id": "0(out1)->1",
        "type": "default",
        "animated": false,
        "sourceHandle": "out1"
    },
    {
        "source": "0",
        "target": "2",
        "id": "0(out2)->2(in2)",
        "type": "default",
        "animated": false,
        "sourceHandle": "out2",
        "targetHandle": "in2"
    },
    {
        "source": "1",
        "target": "2",
        "id": "1->2(in1)",
        "type": "default",
        "animated": false,
        "targetHandle": "in1"
    }
]
By combining custom node types, node nesting and custom styles, you create graphs for complex couplings.

Conclusion
Thanks to trame-flow, we can now integrate customizable and highly interactive flowcharts in trame applications. More examples showing how to use trame-flow are available on https://github.com/Kitware/trame-flow.
Looking to take your application to new heights? Get in touch with Kitware for expert development and support services and fast-track your success with trame.
Acknowledgement
This development has been funded by Safran Tech.